| Listing 1 - 10 of 17 | << page >> |
Sort by
|
ISBN: 0471715751 9780471715757 Year: 2005 Publisher: Hoboken, N.J. Wiley
Abstract | Keywords | Export | Availability | Bookmark
 Loading...
Choose an application
- Reference Manager
- EndNote
- RefWorks (Direct export to RefWorks)
Mathematical statistics --- #PBIB:2005.3 --- Resampling (Statistics) --- Methoden en technieken --- statistiek --- S-Plus. --- Resampling (Statistics). --- statistiek. --- Resampling methods (Statistics) --- SPlus --- Nonparametric statistics
ISBN: 1280759895 9786610759897 0199747733 9780199747733 9780195120257 0195120256 9781280759895 6610759898 0197737781 Year: 1998 Publisher: New York : Oxford University Press,
Abstract | Keywords | Export | Availability | Bookmark
 Loading...
Choose an application
- Reference Manager
- EndNote
- RefWorks (Direct export to RefWorks)
Statistical analysis typically involves applying theoretically generated techniques to the description and interpretation of collected data. This text combines theory, application and interpretation to create an entire biostatistical process.
Biometry. --- Biology --- Biological statistics --- Biometrics (Biology) --- Biostatistics --- Biomathematics --- Statistics --- Data processing. --- Statistical methods --- S-Plus. --- SPlus --- S (Computer program language) --- S-Plus (Computer file)
ISBN: 0849371686 9780849371684 Year: 2001 Publisher: Boca Raton, Florida: CRC,
Abstract | Keywords | Export | Availability | Bookmark
 Loading...
Choose an application
- Reference Manager
- EndNote
- RefWorks (Direct export to RefWorks)
Biomathematics. Biometry. Biostatistics --- Mathematical statistics --- Environmental sciences --- Statistical methods --- Data processing. --- Basic Sciences. Statistics --- Applied Statistics --- S-Plus. --- Applied Statistics. --- Environmental science --- Statistical methods&delete& --- Data processing --- SPlus --- Science --- Environmental sciences - Statistical methods - Data processing.
ISBN: 0387949852 1475727518 9780387949857 Year: 1997 Publisher: New York: Springer,
Abstract | Keywords | Export | Availability | Bookmark
 Loading...
Choose an application
- Reference Manager
- EndNote
- RefWorks (Direct export to RefWorks)
S-PLUS is a powerful tool for interactive data analysis, creating graphs, and implementing customized routines. Originating as the S language of AT&T Bell Laboratories, its modern language and flexibility make it appealing to data analysts from many scientific fields. This book explains the basics of S-PLUS in a clear style at a level suitable for people with little computing or statistical knowledge. Unlike the S-PLUS manuals, it is not comprehensive, but instead introduces the most important ideas of S-PLUS through the use of many examples. Each chapter also includes a collection of exercises which are accompanied by fully worked-out solutions and detailed comments. The volume is rounded off with practical hints on how efficient work can be performed in S-PLUS. The book is well-suited for self-study and as a textbook.
Mathematical statistics --- Data processing. --- Programming --- -Mathematics --- Statistical inference --- Statistics, Mathematical --- Statistics --- Probabilities --- Sampling (Statistics) --- Data processing --- Statistical methods --- S-Plus. --- SPlus --- Statistics . --- Statistics, general. --- Statistical analysis --- Statistical data --- Statistical science --- Mathematics --- Econometrics --- Mathematical statistics - Data processing.
ISBN: 0761922792 0761922806 Year: 2002 Publisher: Thousand Oaks, Calif. Sage
Abstract | Keywords | Export | Availability | Bookmark
 Loading...
Choose an application
- Reference Manager
- EndNote
- RefWorks (Direct export to RefWorks)
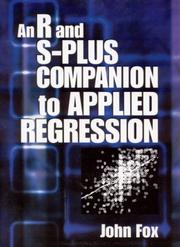
"The text does an outstanding job of providing the necessary mechanics and theory of the S language. I will use this book in every such course that I teach from this point on." 						 JEFF GILL, University of Florida, Gainesville "The book provides a valuable supplement to texts on regression analysis and linear models by showing readers how to put into practice the strategies and techniques involved in modern statistical methodology. It explains clearly the use of a very sophisticated and powerful statistical software system. And, while the examples and objectives are focused closely on regression and related techniques, the discussion successfully conveys general advice and principles for statistical computing with the S system." 					 WILLIAM JACOBY, University of South Carolina Features: Various facilities of S are introduced as needed within the context of detailed examples Cumulative examples: later examples often depend upon earlier ones, but examples in separate chapters are always independent of each other Asterisks note more demanding material that may be skipped without loss of continuity Boxes explain and highlight the many small differences between S-PLUS and R, and between S3 and S4, so that the reader can quickly locate the material that is relevant to their version of S or skip that information A companion Web site, featuring: instructions for downloading, installing, and using the Windows version of R; add-on packages; versions of the car (companion to applied regression) library that includes the software and data sets described in the book; an appendix for various extensions of regression analysis not covered in the text; and downloadable scripts for all of the examples in the text "If you want to keep up with the latest developments in statistics, you need to use the computer language S. If you want to learn S, there isn't a better way to get started than Fox's An R and S-Plus Companion to Applied Regressio
Computer. Automation --- Mathematical statistics --- regressie-analyse --- wiskundige statistiek --- Regression analysis --- R (Computer program language) --- -R (Computer program language) --- 519.536 --- GNU-S (Computer program language) --- Domain-specific programming languages --- Analysis, Regression --- Linear regression --- Regression modeling --- Multivariate analysis --- Structural equation modeling --- Data processing. --- Data processing --- S-Plus. --- SPlus --- R (Computer program language).
Book
ISBN: 0387943501 3540943501 1489928219 1489928197 9780387943503 9783540943501 Year: 1996 Publisher: New York: Springer,
Abstract | Keywords | Export | Availability | Bookmark
 Loading...
Choose an application
- Reference Manager
- EndNote
- RefWorks (Direct export to RefWorks)
S-PLUS (computer program language) --- Statistics --- Mathematical statistics --- Data processing --- 519.23 --- 519.25 --- #WWIS:didaktiek --- Statistical analysis. Inference methods --- Statistical data handling --- 519.25 Statistical data handling --- 519.23 Statistical analysis. Inference methods --- S-Plus. --- SPlus --- Programming --- Data processing. --- #SBIB:303H4 --- Informatica in de sociale wetenschappen --- Statistics - Data processing --- Mathematical statistics - Data processing
ISBN: 0387982140 1475727216 1475727194 Year: 1997 Publisher: New York (N.Y.) : Springer,
Abstract | Keywords | Export | Availability | Bookmark
 Loading...
Choose an application
- Reference Manager
- EndNote
- RefWorks (Direct export to RefWorks)
S-PLUS is a powerful environment for the statistical and graphical analysis of data. It provides the tools to implement many statistical ideas which have been made possible by the widespread availability of workstations having good graphics and computational capabilities. This book is a guide to using S-PLUS to perform statistical analyses and provides both an introduction to the use of S-PLUS and a course in modern statistical methods. S-PLUS is available for both Windows and UNIX workstations, and both versions are covered in depth. The aim of the book is to show how to use S-PLUS as a powerful and graphical system. Readers are assumed to have a basic grounding in statistics, and so the book is intended for would-be users of S-PLUS, and both students and researchers using statistics. Throughout, the emphasis is on presenting practical problems and full analyses of real data sets. Many of the methods discussed are state-of-the-art approaches to topics such as linear and non-linear regression models, robust and smooth regression methods, survival analysis, multivariate analysis, tree-based methods, time series, spatial statistics, and classification. This second edition is intended for users of S-PLUS 3.3, 4.0, or later. It covers the recent developments in graphics and new statistical functionality, including bootstraping, mixed effects, linear and non-linear models, factor analysis, and regression with autocorrelated errors. The material on S-PLUS programming has been re-written to explain the full story behind the object-oriented programming features. The authors have written several software libraries which enhance S-PLUS; these and all the datasets used are available on the Internet in versions for Windows and UNIX. There are also on-line complements covering advanced material, further exercises and new features of S-PLUS as they are introduced. Dr. Venables is Head of Department and Senior Lecturer at the Department of.
Programming --- Mathematical statistics --- 519.23 --- 519.25 --- #ABIB:astp --- Statistical analysis. Inference methods --- Statistical data handling --- 519.25 Statistical data handling --- 519.23 Statistical analysis. Inference methods --- S-Plus. --- Statistics --- Data processing --- SPlus --- Data processing. --- Probabilities. --- Information technology. --- Business—Data processing. --- Probability Theory and Stochastic Processes. --- IT in Business. --- Probability --- Statistical inference --- Combinations --- Mathematics --- Chance --- Least squares --- Risk --- IT (Information technology) --- Technology --- Telematics --- Information superhighway --- Knowledge management
ISBN: 0387988254 147573123X 1475731213 Year: 1999 Publisher: New York, N.Y. Springer
Abstract | Keywords | Export | Availability | Bookmark
 Loading...
Choose an application
- Reference Manager
- EndNote
- RefWorks (Direct export to RefWorks)
S-PLUS is a powerful environment for the statistical and graphical analysis of data. It provides the tools to implement many statistical ideas that have been made possible by the widespread availability of workstations having good graphics and computational capabilities. This book is a guide to using S-PLUS to perform statistical analyses and provides both an introduction to the use of S-PLUS and a course in modern statistical methods. S-PLUS is available commercially for both Windows and UNIX workstations, and both versions are covered in depth. The aim of the book is to show how to use S-PLUS as a powerful and graphical data analysis system. Readers are assumed to have a basic grounding in statistics, and so the book is intended for would-be users of S-PLUS, and both students and researchers using statistics. Throughout, the emphasis is on presenting practical problems and full analyses of real data sets. Many of the methods discussed are state-of-the-art approaches to topics such as linear, non-linear, and smooth regression models, tree-based methods, multivariate analysis and pattern recognition, survival analysis, time series and spatial statistics. Throughout modern techniques such as robust methods, non-parametric smoothing and bootstrapping are used where appropriate. This third edition is intended for users of S-PLUS 4.5, 5.0 or later, although S-PLUS 3.3/4 are also considered. The major change from the second edition is coverage of the current versions of S-PLUS. The material has been extensively rewritten using new examples and the latest computationally-intensive methods. Volume 2: S programming, which is in preparation, will provide an in-depth guide for those writing software in the S language.
Programming --- Mathematical statistics --- Statistics --- Statistique --- Statistique mathématique --- Data processing --- Informatique --- S-Plus --- AA / International- internationaal --- 303.0 --- -Mathematical statistics --- -005.369 --- Mathematics --- Statistical inference --- Statistics, Mathematical --- Probabilities --- Sampling (Statistics) --- Statistical analysis --- Statistical data --- Statistical methods --- Statistical science --- Econometrics --- Statistische technieken in econometrie. Wiskundige statistiek (algemene werken en handboeken). --- S-Plus. --- SPlus --- Data processing. --- Statistique mathématique --- 005.369 --- Statistische technieken in econometrie. Wiskundige statistiek (algemene werken en handboeken) --- Statistics . --- Statistics and Computing/Statistics Programs.
Book
ISBN: 1493921215 1493921223 Year: 2015 Publisher: New York, NY : Springer New York : Imprint: Springer,
Abstract | Keywords | Export | Availability | Bookmark
 Loading...
Choose an application
- Reference Manager
- EndNote
- RefWorks (Direct export to RefWorks)
This contemporary presentation of statistical methods features extensive use of graphical displays for exploring data and for displaying the analysis. The authors demonstrate how to analyze data—showing code, graphics, and accompanying tabular listings—for all the methods they cover. They emphasize how to construct and interpret graphs. They discuss principles of graphical design. They identify situations where visual impressions from graphs may need confirmation from traditional tabular results. All chapters have exercises. The authors provide and discuss R functions for all the new graphical display formats. All graphs and tabular output in the book were constructed using these functions. Complete R scripts for all examples and figures are provided for readers to use as models for their own analyses. This book can serve as a standalone text for statistics majors at the master’s level and for other quantitatively oriented disciplines at the doctoral level, and as a reference book for researchers. In-depth discussions of regression analysis, analysis of variance, and design of experiments are followed by introductions to analysis of discrete bivariate data, nonparametrics, logistic regression, and ARIMA time series modeling. The authors illustrate classical concepts and techniques with a variety of case studies using both newer graphical tools and traditional tabular displays. The Second Edition features graphs that are completely redrawn using the more powerful graphics infrastructure provided by R's lattice package. There are new sections in several of the chapters, revised sections in all chapters and several completely new appendices. New graphical material includes: • an expanded chapter on graphics; • a section on graphing Likert Scale Data to build on the importance of rating scales in fields from population studies to psychometrics; • a discussion on design of graphics that will work for readers with color-deficient vision; • an expanded discussion on the design of multi-panel graphics; • expanded and new sections in the discrete bivariate statistics chapter on the use of mosaic plots for contingency tables including the n×2×2 tables for which the Mantel–Haenszel–Cochran test is appropriate; • an interactive (using the shiny package) presentation of the graphics for the normal and t-tables that is introduced early and used in many chapters. The new appendices include discussions of R, the HH package designed for R (the material in the HH package was distributed as a set of standalone functions with the First Edition of this book), the R Commander package, the RExcel system, the shiny package, and a minimal discussion on writing R packages. There is a new appendix on computational precision illustrating and explaining the FAQ (Frequently Asked Questions) about the differences between the familiar real number system and the less-familiar floating point system used in computers. The probability distributions appendix has been expanded to include more distributions (all the distributions in base R) and to include graphs of each. The editing appendix from the First Edition has been split into four expanded appendices—on working style, writing style, use of a powerful editor, and use of LaTeX for document preparation.
Mathematical Statistics --- Mathematics --- Physical Sciences & Mathematics --- Statistics. --- Statistical Theory and Methods. --- Statistics and Computing/Statistics Programs. --- Statistics for Engineering, Physics, Computer Science, Chemistry and Earth Sciences. --- Mathematical statistics. --- Statistical analysis --- Statistical data --- Statistical methods --- Statistical science --- Econometrics --- Statistical inference --- Statistics, Mathematical --- Statistics --- Probabilities --- Sampling (Statistics) --- Mathematical statistics --- R (Computer program language) --- Data processing. --- S-Plus. --- SAS (Computer file) --- Statistics . --- R (Computer program language). --- GNU-S (Computer program language) --- Domain-specific programming languages --- Statistical analysis system --- SAS system --- SPlus

ISBN: 0387279652 9786610189823 1280189827 0387323481 Year: 2006 Publisher: New York, NY : Springer,
Abstract | Keywords | Export | Availability | Bookmark
 Loading...
Choose an application
- Reference Manager
- EndNote
- RefWorks (Direct export to RefWorks)
The field of financial econometrics has exploded over the last decade. This book represents an integration of theory, methods, and examples using the S-PLUS statistical modeling language and the S+FinMetrics module to facilitate the practice of financial econometrics. This is the first book to show the power of S-PLUS for the analysis of time series data. It is written for researchers and practitioners in the finance industry, academic researchers in economics and finance, and advanced MBA and graduate students in economics and finance. Readers are assumed to have a basic knowledge of S-PLUS and a solid grounding in basic statistics and time series concepts. This second edition is updated to cover S+FinMetrics 2.0 and includes new chapters on copulas, nonlinear regime switching models, continuous-time financial models, generalized method of moments, semi-nonparametric conditional density models, and the efficient method of moments. Eric Zivot is an associate professor and Gary Waterman Distinguished Scholar in the Economics Department, and adjunct associate professor of finance in the Business School at the University of Washington. He regularly teaches courses on econometric theory, financial econometrics and time series econometrics, and is the recipient of the Henry T. Buechel Award for Outstanding Teaching. He is an associate editor of Studies in Nonlinear Dynamics and Econometrics. He has published papers in the leading econometrics journals, including Econometrica, Econometric Theory, the Journal of Business and Economic Statistics, Journal of Econometrics, and the Review of Economics and Statistics. Jiahui Wang is a Principal and Trading Research Officer at Barclays Global Investors. He received a Ph.D. in Economics from the University of Washington in 1997. He has published in leading econometrics journals such as Econometrica and Journal of Business and Economic Statistics, and is the Principal Investigator of National Science Foundation SBIR grants. In 2002 Dr. Wang was selected as one of the "2000 Outstanding Scholars of the 21st Century" by International Biographical Centre.
Statistics. --- Economics, Mathematical. --- Econometrics. --- Statistics for Business/Economics/Mathematical Finance/Insurance. --- Statistics and Computing/Statistics Programs. --- Quantitative Finance. --- Mathematical statistics. --- Finance. --- Statistics for Business, Management, Economics, Finance, Insurance. --- Mathematics --- Statistical inference --- Statistics, Mathematical --- Statistics --- Probabilities --- Sampling (Statistics) --- Funding --- Funds --- Economics --- Currency question --- Economics, Mathematical --- Statistical analysis --- Statistical data --- Statistical methods --- Statistical science --- Econometrics --- Statistics . --- Economics, Mathematical . --- Mathematical economics --- Methodology --- S-Plus. --- SPlus --- Finance --- Time-series analysis. --- Mathematical models. --- Econometric models.
| Listing 1 - 10 of 17 | << page >> |
Sort by
|

 Search
 Feedback
 About UniCat
  Help
Help News
News