| Listing 1 - 1 of 1 |
Sort by
|

ISBN: 0963488406 9780963488404 Year: 1993 Publisher: Summit, N.J. Hobart Press
Abstract | Keywords | Export | Availability | Bookmark
 Loading...
Choose an application
- Reference Manager
- EndNote
- RefWorks (Direct export to RefWorks)
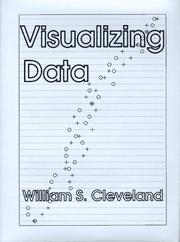
Visualization methods. A strategy for data analysis that stresses the use of visualization to thoroughly study the structure of data and to check the validity of mathematical and statistical models fitted to data. Prerequisites: Basic statistics and least-squares fitting.
Mathematical statistics --- Statistique mathématique --- Graphic methods --- Méthodes graphiques --- 519.25 --- AA / International- internationaal --- 302 --- 001.4224 --- -Mathematical statistics --- -Mathematics --- Statistical inference --- Statistics, Mathematical --- Statistics --- Probabilities --- Sampling (Statistics) --- Statistical data handling --- Opmaak en presentatie van statistische reeksen en tabellen. Grafieken. --- Statistical methods --- -Statistical data handling --- 519.25 Statistical data handling --- -519.25 Statistical data handling --- Mathematics --- Statistique mathématique --- Méthodes graphiques --- Opmaak en presentatie van statistische reeksen en tabellen. Grafieken --- Mathematical statistics - Graphic methods --- QA 276.3 Graphic methods --- Methods --- Computer Imaging, Graphics & Vision
| Listing 1 - 1 of 1 |
Sort by
|

 Search
 Feedback
 About UniCat
  Help
Help News
News