| Listing 1 - 10 of 14 | << page >> |
Sort by
|
Book
Year: 1977 Publisher: Cambridge, Mass. National Bureau of Economic Research
Abstract | Keywords | Export | Availability | Bookmark
 Loading...
Choose an application
- Reference Manager
- EndNote
- RefWorks (Direct export to RefWorks)
Book
Year: 1975 Publisher: Cambridge, Mass. National Bureau of Economic Research
Abstract | Keywords | Export | Availability | Bookmark
 Loading...
Choose an application
- Reference Manager
- EndNote
- RefWorks (Direct export to RefWorks)
Book
Year: 1975 Publisher: Cambridge, Mass. National Bureau of Economic Research
Abstract | Keywords | Export | Availability | Bookmark
 Loading...
Choose an application
- Reference Manager
- EndNote
- RefWorks (Direct export to RefWorks)
Book
Year: 1974 Publisher: Cambridge, Mass. National Bureau of Economic Research
Abstract | Keywords | Export | Availability | Bookmark
 Loading...
Choose an application
- Reference Manager
- EndNote
- RefWorks (Direct export to RefWorks)
Book
Year: 1974 Publisher: Cambridge, Mass. National Bureau of Economic Research
Abstract | Keywords | Export | Availability | Bookmark
 Loading...
Choose an application
- Reference Manager
- EndNote
- RefWorks (Direct export to RefWorks)
Book
Year: 1974 Publisher: Cambridge, Mass. National Bureau of Economic Research
Abstract | Keywords | Export | Availability | Bookmark
 Loading...
Choose an application
- Reference Manager
- EndNote
- RefWorks (Direct export to RefWorks)

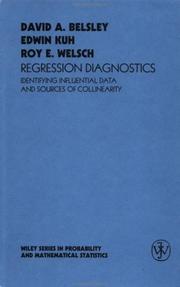
ISBN: 0471058564 9780471058564 Year: 1980 Publisher: New York (N.Y.): Wiley,
Abstract | Keywords | Export | Availability | Bookmark
 Loading...
Choose an application
- Reference Manager
- EndNote
- RefWorks (Direct export to RefWorks)
Mathematical statistics --- Regression analysis --- Analyse de régression --- Regression Analysis --- 519.237 --- 519.235 --- AA / International- internationaal --- 303.0 --- 303.5 --- 303.3 --- Analysis, Regression --- Linear regression --- Regression modeling --- Multivariate analysis --- Structural equation modeling --- Multivariate statistical methods --- Statistics of dependent variables. Contingency tables --- Statistische technieken in econometrie. Wiskundige statistiek (algemene werken en handboeken). --- Theorie van correlatie en regressie. (OLS, adjusted LS, weighted LS, restricted LS, GLS, SLS, LIML, FIML, maximum likelihood). Parametric and non-parametric methods and theory (wiskundige statistiek). --- Waarschijnlijkheid. Probabiliteit. Nauwkeurigheid. Residuals: measurement and specification (wiskundige statistiek). --- Regression analysis. --- 519.235 Statistics of dependent variables. Contingency tables --- 519.237 Multivariate statistical methods --- Analyse de régression --- Statistische technieken in econometrie. Wiskundige statistiek (algemene werken en handboeken) --- Waarschijnlijkheid. Probabiliteit. Nauwkeurigheid. Residuals: measurement and specification (wiskundige statistiek) --- Theorie van correlatie en regressie. (OLS, adjusted LS, weighted LS, restricted LS, GLS, SLS, LIML, FIML, maximum likelihood). Parametric and non-parametric methods and theory (wiskundige statistiek)
Book
Year: 1977 Publisher: Cambridge, Mass. National Bureau of Economic Research
Abstract | Keywords | Export | Availability | Bookmark
 Loading...
Choose an application
- Reference Manager
- EndNote
- RefWorks (Direct export to RefWorks)
This paper attempts to provide the user of linear multiple regression with a battery of diagnostic tools to determine which, if any, data points have high leverage or influence on the estimation process and how these possibly discrepant data points differ from the patterns set by the majority of the data. The point of view taken is that when diagnostics indicate the presence of anomolous data, the choice is open as to whether these data are in fact unusual and helpful, or possibly harmful and thus in need of modifications or deletion. The methodology developed depends on differences, derivatives, and decompositions of basic regression statistics. There is also a discussion of how these techniques can be used with robust and ridge estimators. An example is given showing the use of diagnostic methods in the estimation of a cross-country savings rate model.
Book
Year: 1974 Publisher: Cambridge, Mass. National Bureau of Economic Research
Abstract | Keywords | Export | Availability | Bookmark
 Loading...
Choose an application
- Reference Manager
- EndNote
- RefWorks (Direct export to RefWorks)
This paper considers the effect of aggregation on the variance of parameter estimates for a linear regression model with random coefficients and an additive error term. Aggregate and microvariances are compared and measures of relative efficiency are introduced. Necessary conditions for efficient aggregation procedures are obtained from the Theil aggregation weights and from measures of synchronization related to the work of Grunfeld and Griliches.
Book
Year: 1975 Publisher: Cambridge, Mass. National Bureau of Economic Research
Abstract | Keywords | Export | Availability | Bookmark
 Loading...
Choose an application
- Reference Manager
- EndNote
- RefWorks (Direct export to RefWorks)
This paper describes the results of a Monte Carlo study of certain aspects of robust regression confidence region estimation for linear models with one, five, and seven parameters. One-step sine estimators (c = l.42) were used with design matrices consisting of short-tailed, Gaussian, and long-tailed columns. The samples were generated from a variety of contaminated Gaussian distributions. A number of proposals for covariance matrices were tried, including forms derived from asymptotic considerations and from weighted-least squares with data dependent weights. Comparisons with: the Monte Carlo "truth" were made using generalized eigenvalues. In order to measure efficiency and compute approximate t-values, linear combinations of parameters corresponding to the largest eigenvalues of the "truth" were examined. For design matrices with columns of modest kurtosis, the covariance estimators all give reasonable results and, after adjusting for asymptotic bias, some useful approximate t-values can be obtained. This implies that the standard weighted least-squares output using data-dependent weights need only be modified slightly to give useful robust confidence intervals. When design matrix kurtosis is high and severe contamination is present in the data, these simple approximations are not adequate.
| Listing 1 - 10 of 14 | << page >> |
Sort by
|

 Search
 Feedback
 About UniCat
  Help
Help News
News