
 Search
 Feedback
 About UniCat
  Help
Help News
News
| Listing 11 - 18 of 18 | << page >> |
Sort by
|
Book
ISBN: 9783037784365 3037784369 Year: 2014 Publisher: Zurich Lars Muller Publishers
Abstract | Keywords | Export | Availability | Bookmark
 Loading...
Choose an application
- Reference Manager
- EndNote
- RefWorks (Direct export to RefWorks)
Sixteen internationally reputed designers were interviewed by the editors Inge Gobert and Johan Van Looveren. All are active in the broad field of information design: interactive, editorial, and environmental design, data visualization, way finding, typography, cartography. . . This book contains reflections on the field of information design and its boundaries, working methods, client-designer relations, attitudes, dreams, and frustrations. Special emphasis is placed on how future information designers can be effectively prepared to work in a world that is supposed to provide constant access to information
Graphic arts --- grafisch ontwerp --- grafisch design --- grafische vormgeving --- 766.022 --- 766.01 --- 373.67 --- designonderwijs --- kunstonderwijs --- Vande Moere Andrew --- Uebele Andreas --- Schuller Gerlinde --- R2 --- Porter Mark --- Myerscough Morag --- Mwmcreative --- Maltha Joris --- Malia Joe --- Gutiérrez Fernando --- Grootens Joost --- Fendley Tim --- Epple Rose --- Dawes Brendan --- Crnokrak Peter --- Bergerhausen Johannes --- signalisatie --- bewegwijzering --- cartografie --- typografie --- informatiedesign --- 766.039 --- 766:659.2 --- Grafische vormgeving ; visuele communicatie ; 21ste eeuw --- Communication Design --- LUCA ; School of Arts --- Communicatiedesign ; grafisch ; elektronisch --- Environmental design --- Grafische vormgeving ;reclame ; 2010-2015 --- 745 --- 745.037 --- 766 --- Gebruiksgrafiek ; 2000 - 2050 --- Gebruiksgrafiek ; voorlichting ; adviezen --- Onderwijs (design) --- Design --- 21ste eeuw (design) --- Eenentwintigste eeuw (design) --- Grafische vormgeving --- Infografiek --- Datavisualisatie --- Aide à la création artistique --- Créativité --- 766.32.044 --- Grafische industrie en ontwerp ; beeld ; illustratie ; thema's ; infographics --- design [discipline] --- visualization [computer] --- digitale vormgeving --- visuele communicatie


ISBN: 9783899552171 9783899552782 3899552784 3899552172 Year: 2010 Publisher: Berlin Gestalten
Abstract | Keywords | Export | Availability | Bookmark
Loading...Choose an application
- Reference Manager
- EndNote
- RefWorks (Direct export to RefWorks)
"The eight comprehensive chapters in Data Flow 2 expand the definition of contemporary information graphics. Wide-ranging examples introduce new techniques and forms of expression. In addition to the inspiring visuals, interviews with the New York Times's Steve Duenes, Infosthetic's Andrew Vande Moere, Visualcomplexity's Manuel Lima, Art+Com's Joachim Sauter, and passionate cartographer Menno-Jan Kraak as well as text features by Johannes Schardt provide insight into the challenges of creating effective work."--Cover.
scientific illustrations [images] --- grafische communicatie --- Advertising. Public relations --- reclamevormgeving --- Graphic arts --- visualisatie (informatica) --- visualization [computer] --- wetenschappelijke illustraties --- grafische vormgeving --- graphic design --- advertising --- Design. --- Diagramm. --- Gebrauchsgraphik. --- Visual communication. --- Communication in design. --- Information visualization. --- Arts graphiques --- Communication visuelle --- Communication en design --- Visualisation de l'information --- History --- Histoire --- 766.022 --- diagrammen --- eenentwintigste eeuw --- grafieken --- grafisch design --- informatie --- informatiedesign --- 766 --- grafisch ontwerpen --- 007 --- 655 --- 31 --- 766:659.2 --- Architecturale communicatiemethoden ; portfolio's ; diagrammen --- toegepaste grafische kunsten --- Visuele communicatie --- Grafische vormgeving --- Toegepaste grafische kunst --- Grafische industrie --- Gebruiksgrafiek --- Statistieken --- Statistiek --- Gebruiksgrafiek ; voorlichting ; adviezen --- Communication in design --- Information visualization --- Visual communication --- 754.46 --- signalisatie (bewegwijzering) --- tabellen --- Graphic communication --- Imaginal communication --- Pictorial communication --- Communication --- Data visualization --- Visualization of information --- Information science --- Visual analytics --- Art, Graphic --- Arts, Graphic --- Graphic design (Graphic arts) --- Graphics --- Art --- Design --- grafische vormgeving, volgens thema, info/bewegwijzering --- Information systems --- departement Beeldende Kunst 09 --- diagram --- 766.32.044 --- Grafische industrie en ontwerp ; beeld ; illustratie ; thema's ; infographics --- communication design
Book
ISBN: 9781864706499 186470649X Year: 2016 Publisher: Australia The Images Publishing Group
Abstract | Keywords | Export | Availability | Bookmark
Loading...Choose an application
- Reference Manager
- EndNote
- RefWorks (Direct export to RefWorks)
this comprehensive guide is the latest offering in the international data journalism design market. Not only does it introduce the basic elements of data journalism design, traditional design methods and several complex design forms, but it also presents a large number of outstanding works from around the world.
Newspaper layout and typography. --- Information visualization. --- Infografiek --- Journalism, Pictorial. --- Graphic arts --- Commercial art --- Design --- Visual communication. --- Communication --- Journalism --- 766:659.2 --- Grafische vormgeving ; visualisering kwantitatieve informatie --- Grafische vormgeving ; informatieweergave --- Infografieken --- Infographics --- Visuele communicatie --- #SBIB:309H241 --- #SBIB:309H1025 --- #SBIB:309H524 --- Data visualization --- Visualization of information --- Information science --- Visual analytics --- Communication, Primitive --- Mass communication --- Sociology --- Graphic communication --- Imaginal communication --- Pictorial communication --- Pictorial journalism --- Illustrated periodicals --- Newspapers --- Technique. --- Graphic methods. --- Data processing. --- Gebruiksgrafiek ; voorlichting ; adviezen --- Andere media: functies, genres, historiek --- Mediaboodschappen met een informatieve functie --- Audiovisuele communicatie: semiotiek --- Journalism, Pictorial --- Visual communication --- Information visualization --- Technique --- Graphic methods --- Data processing --- Graphic arts - Technique --- Commercial art - Technique --- Design - Technique --- Journalism - Data processing --- 766.32.044 --- Grafische industrie en ontwerp ; beeld ; illustratie ; thema's ; infographics
Book
ISBN: 9789056623500 9056623508 Year: 2008 Publisher: Rotterdam NAI
Abstract | Keywords | Export | Availability | Bookmark
Loading...Choose an application
- Reference Manager
- EndNote
- RefWorks (Direct export to RefWorks)
City planners --- City planning --- Urbanistes --- Urbanisme --- Biography --- Philosophy --- Exhibitions. --- Biographies --- Philosophie --- Expositions --- Neurath, Otto, --- Neurath, Otto --- Neurath, Otto 1882-1945 (°Wenen, Oostenrijk) --- Architectuurtekenen ; grafische weergave --- Steden ; technologie en maatschappij --- Beeldstatistiek ; 1ste h. 20ste eeuw ; Otto Neurath --- ISOTYPE International System of Typographic Picture Education --- Wiener Kreis --- Grafieken ; statistieken --- Grafische vormgeving ; visuele instructies ; pictogrammen --- Ideogrammen --- Arntz, Gerd --- Gebruiksgrafiek ; voorlichting ; adviezen --- 71.03 --- 72.07 --- 766:659.2 --- Sociale geografie --- Visuele communicatie --- Sociologie --- Pictogrammen --- Stedenbouw (geschiedenis) --- Architecten. Stedenbouwkundigen A - Z --- grafische vormgeving --- Graphic arts --- graphic design --- Cities and towns --- Civic planning --- Land use, Urban --- Model cities --- Redevelopment, Urban --- Slum clearance --- Town planning --- Urban design --- Urban development --- Urban planning --- Land use --- Planning --- Art, Municipal --- Civic improvement --- Regional planning --- Urban policy --- Urban renewal --- Town planners --- Urbanists --- Architects --- Planners --- Government policy --- Management --- 766.23.07 --- Grafische industrie en ontwerp ; schrift ; logo & pictogram ; logo-ontwerpers ; pictografische taalsystemen
Book
ISBN: 9780500022115 0500022119 Year: 2018 Publisher: United Kingdom Thames & Hudson
Abstract | Keywords | Export | Availability | Bookmark
Loading...Choose an application
- Reference Manager
- EndNote
- RefWorks (Direct export to RefWorks)
Look & See offers a very personal insight into the idiosyncratic influences and inspirations behind the creativity of Anthony Burrill, designer and letterpress guru. Selecting from his private collection of printed matter, lovingly gathered and curated throughout his career, this is a celebration of the pieces of paper that surround our everyday lives, offering a whimsical and, at times, almost philosophical perspective on how we view printed artefacts. Each piece is accompanied by an observation by Burrill that reveals his sensitive knowledge and understanding about design and its place it the real world. Beautifully crafted into a whole much greater than the sum of its delightful parts, this is a publication that will entrance and be treasured in equal measure.
Graphic arts --- Commercial art --- Design --- Printed ephemera --- 766:659.2 --- Ephemera, Printed --- Ephemeral printing --- Printing, Ephemeral --- Street literature --- Creation (Literary, artistic, etc.) --- Advertising, Art in --- Advertising, Pictorial --- Advertising art --- Art, Commercial --- Art in advertising --- Commercial design --- Advertising --- Art --- Art and industry --- Posters --- Visual communication --- Motion picture billboards --- Art, Graphic --- Arts, Graphic --- Graphic design (Graphic arts) --- Graphics --- Gebruiksgrafiek ; voorlichting ; adviezen --- Burrill, Anthony --- Art collections. --- 766.07 --- 766.01 --- 766:316.77 --- Grafische vormgeving ; A. Burrill ; beschouwingen over design --- Gebruiksgrafiek ; grafische designers, reclamekunstenaars, typografen, illustrators A-Z --- Gebruiksgrafiek ; theorie, filosofie, esthetica --- Gebruiksgrafiek ; sociale communicatie ; sociologie van de communicatie --- Typografie --- Grafische vormgeving --- Vormgevers --- Letterpress --- Vormgever --- 766.23.01 --- Grafische industrie en ontwerp ; logo & pictogram ; theorie, filosofie, esthetica
Book
ISBN: 9783899556391 3899556399 Year: 2016 Publisher: Berlin Gestalten
Abstract | Keywords | Export | Availability | Bookmark
Loading...Choose an application
- Reference Manager
- EndNote
- RefWorks (Direct export to RefWorks)
"The cutaway illustrations in this book allow our eyes to see what usually remains hidden. They open up houses, bodies, and objects, and allow the individual parts to comprehensively explain the whole. Looking at the outside of things such as architecture, anatomy, or vehicles does not usually reveal much about their internal structures and functions. To learn more, we need to see inside them. Look Inside features infographics that cut up or take apart their subjects and make them transparent. The resulting cross sections and interior views present precise detail in multiple layers. Look Inside starts with a discussion of Arnhem Land, the earliest known cutaway illustrations, showing that even 28,000 years ago, humans had a fascination with how things internally work: the processes that are hidden from the human eye. Including work from both centuries past and the cutting-edge present, Look Inside is an unparalleled compendium of cutaway techniques and their wide-ranging applications. Works from Jewish-German physician Fritz Kahn's imagine the human body as a mechanized factory; Kahn's visual metaphors show conveyor belts and offices instead of veins and valves. Exploded images of classic sports cars allows Fabian Oefner to show every piece of the automotive puzzle from the body shell to individual tiny screws. Richard Orr's scientific pieces represent the natural world and continue in the genre's traditional thread of handmade illustrations; whether a beaver lodge or an arctic circle landscape, Orr presents a vivid natural world or layers and scientific hierarchies. The luxurious collection within Look Inside was curated by renowned information designers and creative directors, Samuel and Juan Velasco. The Velasco brothers have provided invaluable and inspirational insight in the history and theory of cutaway illustrations and visual storytelling."--Publisher.
Technical illustration --- Scientific illustration --- Mechanical drawing --- Industrial design --- Information visualization --- Photography --- Image processing --- Architectural drawing --- Anatomy, Artistic --- 766.049 --- 766:659.2 --- Grafische vormgeving ; visuele instructies --- Visuele communicatie --- Ontleding van beelden ; doorsnedes --- Illustraties ; dwarsdoorsnedes en lengtedoorsnedes van objecten --- Anatomie van gebouwen ; voorwerpen ; ideeën --- Anatomisch tekenen ; menselijk lichaam --- Compositie ; decompositie --- Artistic anatomy --- Human anatomy in art --- Art --- Nude in art --- Human figure in art --- Medicine and art --- Proportion (Art) --- Pictorial data processing --- Picture processing --- Processing, Image --- Imaging systems --- Optical data processing --- Design, Industrial --- New products --- Design --- Drafting, Mechanical --- Engineering drawing --- Industrial drawing --- Mathematical drawing --- Plans --- Technical drawing --- Drawing --- Geometrical drawing --- Graphic statics --- Projection --- Illustration, Scientific --- Science illustration --- Scientific literature --- Art and science --- Illustration of books --- Illustration, Technical --- Technical reports --- Data visualization --- Visualization of information --- Information science --- Visual analytics --- Technique --- Gebruiksgrafiek ; verschillende onderwerpen --- Gebruiksgrafiek ; voorlichting ; adviezen --- Illustration --- Scientific applications --- Advertising. Public relations --- Graphic arts --- visuele communicatie --- grafische vormgeving --- datavisualisatie --- 766.32.046 --- Grafische industrie en ontwerp ; beeld ; illustratie ; thema's ; wetenschappelijke illustraties
ISBN: 0961392142 9780961392147 Year: 2006 Publisher: Cheshire Graphics Press
Abstract | Keywords | Export | Availability | Bookmark
Loading...Choose an application
- Reference Manager
- EndNote
- RefWorks (Direct export to RefWorks)
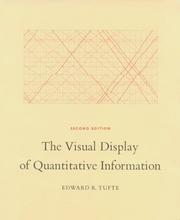
The classic book on statistical graphics, charts, tables. Theory and practice in the design of data graphics, 250 illustrations of the best (and a few of the worst) statistical graphics, with detailed analysis of how to display data for precise, effective, quick analysis. Design of the high-resolution displays, small multiples. Editing and improving graphics. The data-ink ratio. Time-series, relational graphics, data maps, multivariate designs. Detection of graphical deception: design variation vs. data variation. Sources of deception. Aesthetics and data graphical displays. This is the second edition of The Visual Display of Quantitative Information. Recently published, this new edition provides excellent color reproductions of the many graphics of William Playfair, adds color to other images, and includes all the changes and corrections accumulated during 17 printings of the first edition.
Analyse des données --- Communication visuelle --- Graphes --- Représentation graphique --- Statistique --- Theorie des trames --- Statistics --- Graphic methods --- Graphic methods. --- Graphics industry --- Graphic signs --- Graphic arts --- Statistical science --- Mathematical statistics --- 001.4226 --- 028 --- 302 --- 338.755.2 --- AA / International- internationaal --- 007 --- 31 --- 655 --- 7.012 --- 766 --- 681.3*H52 --- 681.3*I6 --- 681.3*H52 Information interfaces and presentation: user interfaces, input devices, input strategies, user interface management systems --- Information interfaces and presentation: user interfaces, input devices, input strategies, user interface management systems --- 681.3*I6 Simulation and modeling (Computing methodologies)--See also {681.3*G3} --- Simulation and modeling (Computing methodologies)--See also {681.3*G3} --- Diagrams, Statistical --- Statistical diagrams --- Curve fitting --- Lectuur. Adviezen voor de lezers. Snel lezen --- Opmaak en presentatie van statistische reeksen en tabellen. Grafieken --- Drukkerij en uitgeverij --- Communicatie --- Visuele communicatie --- Statistiek --- Statistieken --- Grafische industrie --- Ontwerp (kunst) --- Gebruiksgrafiek --- Grafische vormgeving --- Méthodes graphiques --- 655.26 --- computergrafiek --- webdesign --- grafische vormgeving --- grafisch design --- grafisch ontwerp --- tabellen --- grafieken --- informatiedesign --- 766.022 --- grafische vormgeving, typografie --- Informatie --- Informatieverschaffing --- Statistische gegevens --- Beeldvorming --- 766:659.2 --- Grafieken ; statistieken --- Grafische vormgeving ; visualisering kwantitatieve informatie --- Gebruiksgrafiek ; voorlichting ; adviezen --- Monograph --- Sport --- Statistics - Graphic methods --- 766.32.044 --- Grafische industrie en ontwerp ; beeld ; illustratie ; thema's ; infographics

ISBN: 9780961392123 0961392126 Year: 2012 Publisher: Cheshire, Conn. : Graphics press,
Abstract | Keywords | Export | Availability | Bookmark
Loading...Choose an application
- Reference Manager
- EndNote
- RefWorks (Direct export to RefWorks)
Table des matières complète : -Images and Quantities 13 -Visual and Statistical Thinking: Displays of Evidence for Making Decisions 27 -Explaining Magic: Pictorial Instructions and Disinformation Design 55 -The Smallest Effective Difference 73 -Parallelism: Repetition and Change, Comparison and Surprise 79 -Multiples in Space and Time 105 -Visual Confections: Juxtpositions from the Ocean of thetreams of Story 121
graphic design --- Graphic arts --- Art --- visual perception --- Physiology of nerves and sense organs --- Visual communication --- Communication visuelle --- 007 --- 31 --- 655 --- 7.012 --- 766 --- 003.63 --- 311.218 --- 655.28.026 --- 7.02 --- 695 Communicatie --- #A0305A --- Graphic communication --- Imaginal communication --- Pictorial communication --- Communication --- 766 Toegepaste grafische kunsten. Gebruiksgrafiek: Commerciële grafiek --- Toegepaste grafische kunsten. Gebruiksgrafiek: Commerciële grafiek --- 7.02 Kunsttechniek. Methoden en technieken in de kunst --- Kunsttechniek. Methoden en technieken in de kunst --- 311.218 Grafische voorstellingen van statistieken --- Grafische voorstellingen van statistieken --- 003.63 Diagrammen. Cartogrammen. Schema's. Grafieken--(zie ook {311.218}) --- Diagrammen. Cartogrammen. Schema's. Grafieken--(zie ook {311.218}) --- Communicatie --- Visuele communicatie --- Statistiek --- Statistieken --- Grafische industrie --- Ontwerp (kunst) --- Gebruiksgrafiek --- Grafische vormgeving --- Zetten van specifiek drukwerk. Krantzetten.Zetten van commercieel drukwerk. Zetten van postzegels --- Esotérisme --- Graphes --- Multiple --- Repetition --- Représentation graphique --- Statistique --- Traitement de l'image --- Traitement de l'information --- 302.23 --- 7.071 TUFTE --- 766.022 --- 766.071 TUFTE --- Edward R. Tufte --- grafiek --- grafische vormgeving --- grafisch ontwerp --- illustraties --- informatie --- informatiedesign --- kunst --- narratologie --- Tufte Edward --- twintigste eeuw --- Verenigde Staten --- voorstelling --- Semiotics --- Affective and dynamic functions --- visuele communicatie --- Visual communication. --- Répétition --- 766:659.2 --- Grafieken ; statistieken --- Grafische vormgeving ; informatieweergave --- Gebruiksgrafiek ; voorlichting ; adviezen --- 681.3*I6 --- 681.3*H52 --- 681.3*H52 Information interfaces and presentation: user interfaces, input devices, input strategies, user interface management systems --- Information interfaces and presentation: user interfaces, input devices, input strategies, user interface management systems --- 681.3*I6 Simulation and modeling (Computing methodologies)--See also {681.3*G3} --- Simulation and modeling (Computing methodologies)--See also {681.3*G3} --- 766.32.044 --- Grafische industrie en ontwerp ; beeld ; illustratie ; thema's ; infographics
| Listing 11 - 18 of 18 | << page >> |
Sort by
|