| Listing 1 - 6 of 6 |
Sort by
|

ISBN: 0471681601 9780471681601 Year: 2006 Publisher: Hoboken, N.Y. Wiley
Abstract | Keywords | Export | Availability | Bookmark
 Loading...
Choose an application
- Reference Manager
- EndNote
- RefWorks (Direct export to RefWorks)
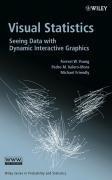
Visual statistics accomplishes the goal of bringing the most complex and advancedstatistical methods within the reach of those with little statistical training by using animated graphics of the data. This text shows how to make dynamic visualizations tht are fully interactive andrespond instantlyto the user's nudges and prods.The graphics are created from relevant mathematical statistics and the interactive presentation of dynamic graphics promotes perceptual and cognitive understanding of the data's story.
Mathematical statistics --- Statistics --- Computer graphics --- Information visualization --- Graphic methods --- Charts, diagrams, etc --- Computer graphics. --- Information visualization. --- Graphic methods. --- communicatie, schriftelijk --- softwarepakketten --- wiskundige statistiek --- Diagrams, Statistical --- Statistical diagrams --- Curve fitting --- Data visualization --- Visualization of information --- Information science --- Visual analytics --- Automatic drafting --- Graphic data processing --- Graphics, Computer --- Computer art --- Graphic arts --- Electronic data processing --- Engineering graphics --- Image processing --- Digital techniques --- Statistics - Graphic methods --- Statistics - Charts, diagrams, etc

ISBN: 128191942X 9786611919429 981277436X 9789812774361 9781281919427 9789812566393 9812566392 Year: 2006 Publisher: Singapore ; Hackensack, NJ : World Scientific,
Abstract | Keywords | Export | Availability | Bookmark
 Loading...
Choose an application
- Reference Manager
- EndNote
- RefWorks (Direct export to RefWorks)
The introduction of quantum field theory methods has led to a kind of "revolution" in condensed matter theory. This resulted in the increased importance of Feynman diagrams or diagram technique. It has now become imperative for professionals in condensed matter theory to have a thorough knowledge of this method.There are many good books that cover the general aspects of diagrammatic methods. At the same time, there has been a rising need for books that describe calculations and methodical "know how" of specific problems for beginners in graduate and postgraduate courses. This unique collection
Condensed matter. --- Quantum field theory. --- Feynman diagrams. --- Many-body problem --- Matrices --- Quantum theory --- Relativistic quantum field theory --- Field theory (Physics) --- Relativity (Physics) --- Condensed materials --- Condensed media --- Condensed phase --- Materials, Condensed --- Media, Condensed --- Phase, Condensed --- Liquids --- Matter --- Solids

ISBN: 9783540358930 3540358935 3540359028 Year: 2006 Publisher: Berlin : Springer,
Abstract | Keywords | Export | Availability | Bookmark
 Loading...
Choose an application
- Reference Manager
- EndNote
- RefWorks (Direct export to RefWorks)
th The 14 International Conference on Conceptual Structures (ICCS 2006) was held in Aalborg, Denmark during July 16 – 21, 2006. Responding to the Call for Papers, we received 62 papers from 20 different countries, representing six different continents. This clearly indicates the international nature of the ICCS community as well as the widespread interest which was spawned by the previous conferences. By a thorough review process, 24 papers were selected to be included in this volume. In addition, six invited speakers made contributions which can be found in the first section of this volume. The theme of ICCS 2006––Conceptual Structures: Inspiration and Application–– points to a dual focus of interest that is also reflected in the constellation of papers. From the beginning of the planning of this conference, we focused on inspirational sources that have led to the current state of research in our community, by tracing important historical influences which daily effect work in representing knowledge and in handling representations of conceptual structures. At the same time, we also focused on ways in which these legacies are employed to further advance theory and practice in the field of knowledge representation and processing. With this volume, we believe that a valuable contribution to both aspects of this field is being made. We wish to express our appreciation to all the authors of submitted papers, to the members of the Editorial Board and the Program Committee for all their work and valuable comments.
Conceptual structures (Information theory) --- Graph theory --- Logic diagrams --- Knowledge representation (Information theory) --- Natural language processing (Computer science) --- Structures conceptuelles --- Théorie des graphes --- Logigrammes --- Représentation des connaissances --- Traitement automatique des langues naturelles --- Congresses. --- Congrès --- Computer Science --- Mechanical Engineering - General --- Engineering & Applied Sciences --- Mechanical Engineering --- Information Technology --- Artificial Intelligence --- Diagrams, Logic --- Logic --- Diagrams --- Graphic methods --- Computer science. --- Algorithms. --- Mathematical logic. --- Computer science --- Artificial intelligence. --- Computer Science. --- Artificial Intelligence (incl. Robotics). --- Discrete Mathematics in Computer Science. --- Mathematical Logic and Formal Languages. --- Algorithm Analysis and Problem Complexity. --- Information Systems Applications (incl. Internet). --- Mathematics. --- AI (Artificial intelligence) --- Artificial thinking --- Electronic brains --- Intellectronics --- Intelligence, Artificial --- Intelligent machines --- Machine intelligence --- Thinking, Artificial --- Bionics --- Cognitive science --- Digital computer simulation --- Electronic data processing --- Logic machines --- Machine theory --- Self-organizing systems --- Simulation methods --- Fifth generation computers --- Neural computers --- Computer mathematics --- Discrete mathematics --- Algebra of logic --- Logic, Universal --- Mathematical logic --- Symbolic and mathematical logic --- Symbolic logic --- Mathematics --- Algebra, Abstract --- Metamathematics --- Set theory --- Syllogism --- Algorism --- Algebra --- Arithmetic --- Informatics --- Science --- Foundations --- Computational complexity. --- Computer software. --- Artificial Intelligence. --- Software, Computer --- Computer systems --- Complexity, Computational --- Computer science—Mathematics. --- Application software. --- Application computer programs --- Application computer software --- Applications software --- Apps (Computer software) --- Computer software

ISBN: 3540306110 3540306102 3642067891 Year: 2006 Publisher: Berlin, Heidelberg : Springer Berlin Heidelberg : Imprint: Springer,
Abstract | Keywords | Export | Availability | Bookmark
 Loading...
Choose an application
- Reference Manager
- EndNote
- RefWorks (Direct export to RefWorks)
The problem of evaluating Feynman integrals over loop momenta has existed from the early days of perturbative quantum field theory. The goal of the book is to summarize those methods for evaluating Feynman integrals that have been developed over a span of more than fifty years. `Feynman Integral Calculus' characterizes the most powerful methods in a systematic way. It concentrates on the methods that have been employed recently for most sophisticated calculations and illustrates them with numerous examples, starting from very simple ones and progressing to nontrivial examples. It also shows how to choose adequate methods and combine them in a non-trivial way. This is a textbook version of the previous book (Evaluating Feynman integrals, STMP 211) of the author. Problems and solutions have been included, Appendix G has been added, more details have been presented, recent publications on evaluating Feynman integrals have been taken into account and the bibliography has been updated.
Calculus, Integral --- Feynman integrals --- Feynman diagrams --- Multiple integrals --- Integral calculus --- Differential equations --- Quantum theory. --- Global analysis (Mathematics). --- Elementary Particles, Quantum Field Theory. --- Analysis. --- Quantum Physics. --- Analysis, Global (Mathematics) --- Differential topology --- Functions of complex variables --- Geometry, Algebraic --- Quantum dynamics --- Quantum mechanics --- Quantum physics --- Physics --- Mechanics --- Thermodynamics --- Feynman integrals. --- Elementary particles (Physics). --- Quantum field theory. --- Mathematical analysis. --- Analysis (Mathematics). --- Quantum physics. --- 517.1 Mathematical analysis --- Mathematical analysis --- Relativistic quantum field theory --- Field theory (Physics) --- Quantum theory --- Relativity (Physics) --- Elementary particles (Physics) --- High energy physics --- Nuclear particles --- Nucleons --- Nuclear physics

ISBN: 0387329064 9780387329062 9786610938421 1280938420 0387379770 Year: 2006 Publisher: Singapore Springer
Abstract | Keywords | Export | Availability | Bookmark
 Loading...
Choose an application
- Reference Manager
- EndNote
- RefWorks (Direct export to RefWorks)
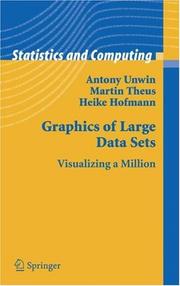
This book shows how to look at ways of visualizing large datasets, whether large in numbers of cases, or large in numbers of variables, or large in both. All ideas are illustrated with displays from analyses of real datasets and the importance of interpreting displays effectively is emphasized. Graphics should be drawn to convey information and the book includes many insightful examples. New approaches to graphics are needed to visualize the information in large datasets and most of the innovations described in this book are developments of standard graphics. The book is accessible to readers with some experience of drawing statistical graphics.
Artificial intelligence. Robotics. Simulation. Graphics --- Information systems --- QA 276.3 Graphic methods --- Computational Science & Engineering --- Computational Statistics --- Computer Imaging, Graphics & Vision --- Computer Science --- Statistics --- Computer graphics. --- Statistique --- Infographie --- Graphic methods. --- Méthodes graphiques --- Computer graphics --- Graphic methods --- Statistics -- Graphic methods. --- Mathematics --- Physical Sciences & Mathematics --- Mathematical Statistics --- Méthodes graphiques --- EPUB-LIV-FT LIVSTATI SPRINGER-B --- Automatic drafting --- Graphic data processing --- Graphics, Computer --- Diagrams, Statistical --- Statistical diagrams --- Mathematics. --- Operations research. --- Decision making. --- Data mining. --- Visualization. --- Computer software. --- Statistics. --- Mathematical Software. --- Statistical Theory and Methods. --- Data Mining and Knowledge Discovery. --- Operation Research/Decision Theory. --- Computer Graphics. --- Computer art --- Graphic arts --- Electronic data processing --- Engineering graphics --- Image processing --- Statistical analysis --- Statistical data --- Statistical methods --- Statistical science --- Econometrics --- Software, Computer --- Computer systems --- Visualisation --- Imagery (Psychology) --- Imagination --- Visual perception --- Algorithmic knowledge discovery --- Factual data analysis --- KDD (Information retrieval) --- Knowledge discovery in data --- Knowledge discovery in databases --- Mining, Data --- Database searching --- Deciding --- Decision (Psychology) --- Decision analysis --- Decision processes --- Making decisions --- Management --- Management decisions --- Choice (Psychology) --- Problem solving --- Operational analysis --- Operational research --- Industrial engineering --- Management science --- Research --- System theory --- Math --- Science --- Digital techniques --- Decision making --- Curve fitting --- Mathematical statistics. --- Operations Research/Decision Theory. --- Statistical inference --- Statistics, Mathematical --- Probabilities --- Sampling (Statistics) --- Statistics . --- Statistics - Graphic methods

ISBN: 0961392142 9780961392147 Year: 2006 Publisher: Cheshire Graphics Press
Abstract | Keywords | Export | Availability | Bookmark
 Loading...
Choose an application
- Reference Manager
- EndNote
- RefWorks (Direct export to RefWorks)
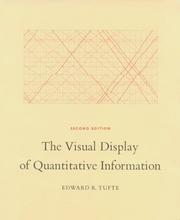
The classic book on statistical graphics, charts, tables. Theory and practice in the design of data graphics, 250 illustrations of the best (and a few of the worst) statistical graphics, with detailed analysis of how to display data for precise, effective, quick analysis. Design of the high-resolution displays, small multiples. Editing and improving graphics. The data-ink ratio. Time-series, relational graphics, data maps, multivariate designs. Detection of graphical deception: design variation vs. data variation. Sources of deception. Aesthetics and data graphical displays. This is the second edition of The Visual Display of Quantitative Information. Recently published, this new edition provides excellent color reproductions of the many graphics of William Playfair, adds color to other images, and includes all the changes and corrections accumulated during 17 printings of the first edition.
Analyse des données --- Communication visuelle --- Graphes --- Représentation graphique --- Statistique --- Theorie des trames --- Statistics --- Graphic methods --- Graphic methods. --- Graphics industry --- Graphic signs --- Graphic arts --- Statistical science --- Mathematical statistics --- 001.4226 --- 028 --- 302 --- 338.755.2 --- AA / International- internationaal --- 007 --- 31 --- 655 --- 7.012 --- 766 --- 681.3*H52 --- 681.3*I6 --- 681.3*H52 Information interfaces and presentation: user interfaces, input devices, input strategies, user interface management systems --- Information interfaces and presentation: user interfaces, input devices, input strategies, user interface management systems --- 681.3*I6 Simulation and modeling (Computing methodologies)--See also {681.3*G3} --- Simulation and modeling (Computing methodologies)--See also {681.3*G3} --- Diagrams, Statistical --- Statistical diagrams --- Curve fitting --- Lectuur. Adviezen voor de lezers. Snel lezen --- Opmaak en presentatie van statistische reeksen en tabellen. Grafieken --- Drukkerij en uitgeverij --- Communicatie --- Visuele communicatie --- Statistiek --- Statistieken --- Grafische industrie --- Ontwerp (kunst) --- Gebruiksgrafiek --- Grafische vormgeving --- Méthodes graphiques --- 655.26 --- computergrafiek --- webdesign --- grafische vormgeving --- grafisch design --- grafisch ontwerp --- tabellen --- grafieken --- informatiedesign --- 766.022 --- grafische vormgeving, typografie --- Informatie --- Informatieverschaffing --- Statistische gegevens --- Beeldvorming --- 766:659.2 --- Grafieken ; statistieken --- Grafische vormgeving ; visualisering kwantitatieve informatie --- Gebruiksgrafiek ; voorlichting ; adviezen --- Monograph --- Sport --- Statistics - Graphic methods --- 766.32.044 --- Grafische industrie en ontwerp ; beeld ; illustratie ; thema's ; infographics
| Listing 1 - 6 of 6 |
Sort by
|

 Search
 Feedback
 About UniCat
  Help
Help News
News