
 Search
 Feedback
 About
About Help
Help News
News
| Listing 1 - 10 of 10 |
Sort by
|
Book
Year: 2005 Publisher: Aberdeen Proving Ground, MD : U.S. Army Research Laboratory,
Abstract | Keywords | Export | Availability | Bookmark
 Loading...
Choose an application
- Reference Manager
- EndNote
- RefWorks (Direct export to RefWorks)
Supercomputers. --- Computer graphics. --- Information visualization.
Book
Year: 2005 Publisher: Aberdeen Proving Ground, MD : U.S. Army Research Laboratory,
Abstract | Keywords | Export | Availability | Bookmark
Loading...Choose an application
- Reference Manager
- EndNote
- RefWorks (Direct export to RefWorks)
Supercomputers. --- Computer graphics. --- Information visualization.
Book

Year: 2005 Publisher: [Place of publication not identified] ACM Press
Abstract | Keywords | Export | Availability | Bookmark
Loading...Choose an application
- Reference Manager
- EndNote
- RefWorks (Direct export to RefWorks)
Computer graphics --- Information visualization --- Visual perception
Book
ISBN: 0769523978 1538600854 Year: 2005 Publisher: [Place of publication not identified] IEEE Computer Society
Abstract | Keywords | Export | Availability | Bookmark
Loading...Choose an application
- Reference Manager
- EndNote
- RefWorks (Direct export to RefWorks)
Book
ISBN: 076952396X 1538601176 Year: 2005 Publisher: [Place of publication not identified] IEEE Computer Society
Abstract | Keywords | Export | Availability | Bookmark
Loading...Choose an application
- Reference Manager
- EndNote
- RefWorks (Direct export to RefWorks)
ISBN: 1589481240 Year: 2005 Publisher: Redlands, Calif. ESRI
Abstract | Keywords | Export | Availability | Bookmark
Loading...Choose an application
- Reference Manager
- EndNote
- RefWorks (Direct export to RefWorks)
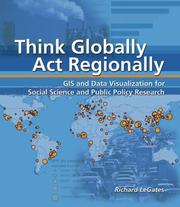
Giving social scientists and students a solid introduction to Geographical Information Systems (GIS), this study focuses on some of society's most pressing issues, including growth, pollution, and economic development. By calling upon such high-end analytical tools as Global Positioning System navigation and satellite imagery, GIS can be a critical tool in examining social problems. This study encourages readers to be visionary and even utopian in imagining better urban futures by concentrating on three related topics& urbanization, conflicts between natural and built environments, and regional equity. The introductory and spatial analysis chapters expand this understanding so that readers see both urban problems and urban opportunities more clearly.
Information systems --- Economic geography --- United States --- Computer graphics. --- Geographic information systems. --- Information visualization. --- Regional planning --- Urban ecology (Sociology) --- Urban ecology --- Urban geography --- Urban policy --- Geografie --- Data processing. --- Geografische Informatie Systemen --- Toepassingen. --- United States of America
Book
ISBN: 2713220270 9782713224171 2713224179 9782713220272 Year: 2005 Publisher: Paris : Éditions EHESS,
Abstract | Keywords | Export | Availability | Bookmark
Loading...Choose an application
- Reference Manager
- EndNote
- RefWorks (Direct export to RefWorks)
Véritable traité de traduction graphique, cet ouvrage explique dans quel cas il est nécessaire de faire un dessin et quel dessin il faut faire, en définissant les fonctions de l'image (inventaire, instrument de traitement de l'information, message) et les propriétés spécifiques de la représentation graphique.
Graphic methods --- Statistics --- Statistical maps --- Information visualization --- Sémiologie --- --Maps, Statistical --- Théorie de l'information --- Cartographie --- Communication visuelle --- Statistique --- Maps, Statistical --- Méthodes graphiques --- Statistical maps. --- Méthodes graphiques --- Statistics - Graphic methods
ISBN: 012387582X 9780123875822 0080481647 9780080481647 1281008206 9786611008208 1417549610 9781417549610 Year: 2005 Publisher: Burlington, MA : Butterworth-Heinemann,
Abstract | Keywords | Export | Availability | Bookmark
Loading...Choose an application
- Reference Manager
- EndNote
- RefWorks (Direct export to RefWorks)
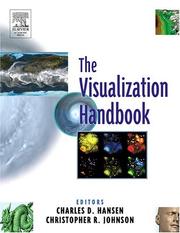
The Visualization Handbook provides an overview of the field of visualization by presenting the basic concepts, providing a snapshot of current visualization software systems, and examining research topics that are advancing the field. This text is intended for a broad audience, including not only the visualization expert seeking advanced methods to solve a particular problem, but also the novice looking for general background information on visualization topics. The largest collection of state-of-the-art visualization research yet gathered in a single volume, this book includes articl
Artificial intelligence. Robotics. Simulation. Graphics --- Information visualization. --- Computer graphics. --- Information visualization --- Computer graphics --- Visualisation de l'information --- Infographie --- ELSEVIER-B EPUB-LIV-FT --- Engineering --- General and Others --- Automatic drafting --- Graphic data processing --- Graphics, Computer --- Computer art --- Graphic arts --- Electronic data processing --- Engineering graphics --- Image processing --- Data visualization --- Visualization of information --- Information science --- Visual analytics --- Digital techniques --- Visualization. --- Science --- Methodology. --- Scientific method --- Logic, Symbolic and mathematical --- Visualisation --- Imagination --- Visual perception --- Imagery (Psychology)
Book
ISBN: 1280460660 9786610460663 0387286950 Year: 2005 Publisher: New York, NY : Springer New York : Imprint: Springer,
Abstract | Keywords | Export | Availability | Bookmark
Loading...Choose an application
- Reference Manager
- EndNote
- RefWorks (Direct export to RefWorks)
This book was written for statisticians, computer scientists, geographers, researchers, and others interested in visualizing data. It presents a unique foundation for producing almost every quantitative graphic found in scientific journals, newspapers, statistical packages, and data visualization systems. While the tangible results of this work have been several visualization software libraries, this book focuses on the deep structures involved in producing quantitative graphics from data. What are the rules that underlie the production of pie charts, bar charts, scatterplots, function plots, maps, mosaics, and radar charts? Those less interested in the theoretical and mathematical foundations can still get a sense of the richness and structure of the system by examining the numerous and often unique color graphics it can produce. The second edition is almost twice the size of the original, with six new chapters and substantial revision. Much of the added material makes this book suitable for survey courses in visualization and statistical graphics. From reviews of the first edition: "Destined to become a landmark in statistical graphics, this book provides a formal description of graphics, particularly static graphics, playing much the same role for graphics as probability theory played for statistics." Journal of the American Statistical Association "Wilkinson’s careful scholarship shows around every corner. This is a tour de force of the highest order." Psychometrika "All geography and map libraries should add this book to their collections; the serious scholar of quantitative data graphics will place this book on the same shelf with those by Edward Tufte, and volumes by Cleveland, Bertin, Monmonier, MacEachren, among others, and continue the unending task of proselytizing for the best in statistical data presentation by example and through scholarship like that of Leland Wilkinson." Cartographic Perspectives "In summary, this is certainly a remarkable book and a new ambitious step for the development and application of statistical graphics." Computational Statistics and Data Analysis About the author: Leland Wilkinson is Senior VP, SPSS Inc. and Adjunct Professor of Statistics at Northwestern University. He is also affiliated with the Computer Science department at The University of Illinois at Chicago. He wrote the SYSTAT statistical package and founded SYSTAT Inc. in 1984. Wilkinson joined SPSS in a 1994 acquisition and now works on research and development of visual analytics and statistics. He is a Fellow of the ASA. In addition to journal articles and the original SYSTAT computer program and manuals, Wilkinson is the author (with Grant Blank and Chris Gruber) of Desktop Data Analysis with SYSTAT. .
Statistics --- Computer graphics. --- Graphic methods --- Data processing. --- Automatic drafting --- Graphic data processing --- Graphics, Computer --- Computer art --- Graphic arts --- Electronic data processing --- Engineering graphics --- Image processing --- Digital techniques --- Statistical analysis --- Statistical data --- Statistical methods --- Statistical science --- Mathematics --- Econometrics --- Mathematical statistics. --- Visualization. --- Computer vision. --- Statistics and Computing/Statistics Programs. --- Computer Imaging, Vision, Pattern Recognition and Graphics. --- Machine vision --- Vision, Computer --- Artificial intelligence --- Pattern recognition systems --- Statistical inference --- Statistics, Mathematical --- Probabilities --- Sampling (Statistics) --- Visualisation --- Imagination --- Visual perception --- Imagery (Psychology) --- Statistics . --- Mathematics. --- Optical data processing. --- Optical computing --- Visual data processing --- Bionics --- Integrated optics --- Photonics --- Computers --- Math --- Science --- Optical equipment --- Mathematical statistics—Data processing. --- Information visualization. --- Image processing—Digital techniques. --- Statistics and Computing. --- Data and Information Visualization. --- Data visualization --- Visualization of information --- Information science --- Visual analytics
ISBN: 1280312203 9786610312207 1846280842 1852337907 1849969183 Year: 2005 Publisher: London : Springer London : Imprint: Springer,
Abstract | Keywords | Export | Availability | Bookmark
Loading...Choose an application
- Reference Manager
- EndNote
- RefWorks (Direct export to RefWorks)
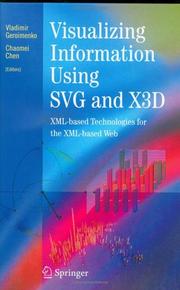
Correcting the Great Mistake People often mistake one thing for another. That’s human nature. However, one would expect the leaders in a particular field of endeavour to have superior abilities to discriminate among the developments within that field. That is why it is so perplexing that the technology elite – supposedly savvy folk such as software developers, marketers and businessmen – have continually mistaken Web-based graphics for something it is not. The first great graphics technology for the Web, VRML, has been mistaken for something else since its inception. Viewed variously as a game system, a format for architectural walkthroughs, a platform for multi-user chat and an augmentation of reality, VRML may qualify as the least understood invention in the history of information technology. Perhaps it is so because when VRML was originally introduced it was touted as a tool for putting the shopping malls of the world online, at once prosaic and horrifyingly mundane to those of us who were developing it. Perhaps those first two initials, “VR”, created expectations of sprawling, photorealistic fantasy landscapes for exploration and play across the Web. Or perhaps the magnitude of the invention was simply too great to be understood at the time by the many, ironically even by those spending the money to underwrite its development. Regardless of the reasons, VRML suffered in the mainstream as it was twisted to meet unintended ends and stretched far beyond its limitations.
Computer graphics. --- SVG (Document markup language) --- XML (Document markup language) --- Semantic Web. --- Information visualization. --- Automatic drafting --- Graphic data processing --- Graphics, Computer --- Computer art --- Graphic arts --- Electronic data processing --- Engineering graphics --- Image processing --- Digital techniques --- Data visualization --- Visualization of information --- Information science --- Visual analytics --- Semantic integration (Computer systems) --- Semantic networks (Information theory) --- World Wide Web --- Microformats --- Extendible Markup Language (Document markup language) --- eXtensible Markup Language (Document markup language) --- Document markup languages --- Scalable Vector Graphics (Document markup language) --- XML --- Computer science. --- Multimedia systems. --- Optical pattern recognition. --- User Interfaces and Human Computer Interaction. --- Multimedia Information Systems. --- Computer Graphics. --- Information Systems Applications (incl. Internet). --- Pattern Recognition. --- Optical data processing --- Pattern perception --- Perceptrons --- Visual discrimination --- Computer-based multimedia information systems --- Multimedia computing --- Multimedia information systems --- Multimedia knowledge systems --- Information storage and retrieval systems --- Informatics --- Science --- User interfaces (Computer systems). --- Multimedia information systems. --- Application software. --- Pattern recognition. --- Design perception --- Pattern recognition --- Form perception --- Perception --- Figure-ground perception --- Application computer programs --- Application computer software --- Applications software --- Apps (Computer software) --- Computer software --- Interfaces, User (Computer systems) --- Human-machine systems --- Human-computer interaction
| Listing 1 - 10 of 10 |
Sort by
|