| Listing 1 - 1 of 1 |
Sort by
|

ISBN: 0961392142 9780961392147 Year: 2006 Publisher: Cheshire Graphics Press
Abstract | Keywords | Export | Availability | Bookmark
 Loading...
Choose an application
- Reference Manager
- EndNote
- RefWorks (Direct export to RefWorks)
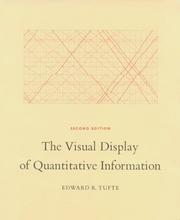
L'auteur, Edward Tufte, porte la technique de la représentation graphiques de données statistiques au niveau d'un art raffiné. Il illustre son propos d'exemples historiques d'utilisation du potentiel explicatif des représentations visuelles.Ce livre est utile à toutes les personnes qui doivent représenter des données quantitatives. L'auteur donne ainsi une dimension esthétique au domaine de l'analyse de données...
Analyse des données --- Communication visuelle --- Graphes --- Représentation graphique --- Statistique --- Theorie des trames --- Statistics --- Graphic methods --- Graphic methods. --- Graphics industry --- Graphic signs --- Graphic arts --- Statistical science --- Mathematical statistics --- 001.4226 --- 028 --- 302 --- 338.755.2 --- AA / International- internationaal --- 007 --- 31 --- 655 --- 7.012 --- 766 --- 681.3*H52 --- 681.3*I6 --- 681.3*H52 Information interfaces and presentation: user interfaces, input devices, input strategies, user interface management systems --- Information interfaces and presentation: user interfaces, input devices, input strategies, user interface management systems --- 681.3*I6 Simulation and modeling (Computing methodologies)--See also {681.3*G3} --- Simulation and modeling (Computing methodologies)--See also {681.3*G3} --- Diagrams, Statistical --- Statistical diagrams --- Curve fitting --- Lectuur. Adviezen voor de lezers. Snel lezen --- Opmaak en presentatie van statistische reeksen en tabellen. Grafieken --- Drukkerij en uitgeverij --- Communicatie --- Visuele communicatie --- Statistiek --- Statistieken --- Grafische industrie --- Ontwerp (kunst) --- Gebruiksgrafiek --- Grafische vormgeving --- Méthodes graphiques --- 655.26 --- computergrafiek --- webdesign --- grafische vormgeving --- grafisch design --- grafisch ontwerp --- tabellen --- grafieken --- informatiedesign --- 766.022 --- grafische vormgeving, typografie --- Informatie --- Informatieverschaffing --- Statistische gegevens --- Beeldvorming --- 766:659.2 --- Grafieken ; statistieken --- Grafische vormgeving ; visualisering kwantitatieve informatie --- Gebruiksgrafiek ; voorlichting ; adviezen --- Monograph --- Sport --- Statistics - Graphic methods --- 766.32.044 --- Grafische industrie en ontwerp ; beeld ; illustratie ; thema's ; infographics
| Listing 1 - 1 of 1 |
Sort by
|

 Search
 Feedback
 About UniCat
  Help
Help News
News