| Listing 1 - 10 of 25 | << page >> |
Sort by
|
Book
ISBN: 9781442249929 9781442249936 1442249927 1442249935 Year: 2016 Publisher: Lanham : Rowman & Littlefield,
Abstract | Keywords | Export | Availability | Bookmark
 Loading...
Choose an application
- Reference Manager
- EndNote
- RefWorks (Direct export to RefWorks)
Statistics for Library and Information Services, written for non-statisticians, provides logical, user-friendly, and step-by-step instructions to make statistics more accessible for students and professionals in the field of Information Science. It emphasizes concepts of statistical theory and data collection methodologies, but also extends to the topics of visualization creation and display, so that the reader will be able to better conduct statistical analysis and communicate findings. The book is tailored for information science students and professionals. It has specific examples of dataset sets, scripts, design modules, data repositories, homework assignments, and a glossary lexicon that matches the field of Information Science. The textbook provides a visual road map that is customized specifically for Information Science instructors, students, and professionals regarding statistics and visualization. Don't miss the book's companion Web site at www.statisticsforlis.org.
Programming --- Statistical science --- Library research --- Information science --- Library statistics --- R (Computer program language) --- Information visualization --- Statistical methods --- Information science - Statistical methods --- Library statistics. --- Information visualization. --- Statistical methods.
Book
ISBN: 9781118794388 9781118858417 9781118858349 Year: 2014 Publisher: Hoboken, New Jersey : Wiley,
Abstract | Keywords | Export | Availability | Bookmark
 Loading...
Choose an application
- Reference Manager
- EndNote
- RefWorks (Direct export to RefWorks)
"The era of Big Data as arrived, and most organizations are woefully unprepared. Slowly, many are discovering that stalwarts like Excel spreadsheets, KPIs, standard reports, and even traditional business intelligence tools aren't sufficient. These old standbys can't begin to handle today's increasing streams, volumes, and types of data. Amidst all of the chaos, though, a new type of organization is emerging. In The Visual Organization, award-winning author and technology expert Phil Simon looks at how an increasingly number of organizations are embracing new dataviz tools and, more important, a new mind-set based upon data discovery and exploration. Simon adroitly shows how Amazon, Apple, Facebook, Google, Twitter, and other tech heavyweights use powerful data visualization tools to garner fascinating insights into their businesses. But make no mistake: these companies are hardly alone. Organizations of all types, industries, sizes are representing their data in new and amazing ways. As a result, they are asking better questions and making better business decisions. Rife with real-world examples and case studies, The Visual Organization is a full-color tour-de-force"--
Information systems --- Organization theory --- Information technology --- Information visualization. --- Big data. --- Business --- Management. --- Data processing.
Multi
ISBN: 9780128128763 0128128763 9780128128756 0128128755 Year: 2021 Publisher: Cambridge, MA : Morgan Kaufmann,
Abstract | Keywords | Export | Availability | Bookmark
 Loading...
Choose an application
- Reference Manager
- EndNote
- RefWorks (Direct export to RefWorks)
Information Visualization: Perception for Design, Fourth Edition explores the art and science of why we see objects the way we do. Based on the science of perception and vision, the author presents the key principles at work for a wide range of applications--resulting in visualization of improved clarity, utility and persuasiveness. This new edition has been revised and updated to include the latest relevant research findings. Content has been updated in areas such as the cognitive neuroscience of maps and navigation, the neuroscience of pattern perception, and the hierarchy of learned patterns.New changes to the book make it easier to apply perceptual lessons to design decisions. In addition, the book offers practical guidelines that can be applied by anyone, including interaction designers and graphic designers of all kinds.
Visual perception. --- Information visualization. --- Design. --- SGBD = Systèmes de gestion de bases de données --- database --- information

ISBN: 9780080503288 0080503284 1558609156 9781558609150 1281078239 9781281078230 9786611078232 6611078231 Year: 2003 Publisher: Amsterdam ; London : Morgan Kaufmann,
Abstract | Keywords | Export | Availability | Bookmark
 Loading...
Choose an application
- Reference Manager
- EndNote
- RefWorks (Direct export to RefWorks)
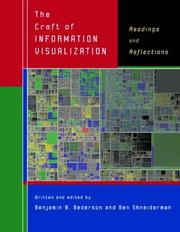
Since the beginning of the computer age, researchers from many disciplines have sought to facilitate people's use of computers and to provide ways for scientists to make sense of the immense quantities of data coming out of them. One gainful result of these efforts has been the field of information visualization, whose technology is increasingly applied in scientific research, digital libraries, data mining, financial data analysis, market studies, manufacturing production control, and data discovery.This book collects 38 of the key papers on information visualization from a leading
Book
ISBN: 9780691181622 9780691181615 0691181624 0691181616 Year: 2018 Publisher: Princeton, NJ : Princeton University Press,
Abstract | Keywords | Export | Availability | Bookmark
 Loading...
Choose an application
- Reference Manager
- EndNote
- RefWorks (Direct export to RefWorks)
"This book provides students and researchers a hands-on introduction to the principles and practice of data visualization. It explains what makes some graphs succeed while others fail, how to make high-quality figures from data using powerful and reproducible methods, and how to think about data visualization in an honest and effective way. Data visualization builds the reader's expertise in ggplot2, a versatile visualization library for the R programming language ...."--Page 4 of cover.

ISBN: 2713212774 9782713212772 Year: 1999 Publisher: Paris Ecole des hautes études en sciences sociales
Abstract | Keywords | Export | Availability | Bookmark
 Loading...
Choose an application
- Reference Manager
- EndNote
- RefWorks (Direct export to RefWorks)
Docteur ès-Lettres, Cartographe-Géographe, Jacques Bertin était directeur d'études à l'École des Hautes Études en Sciences Sociales (EHESS). Fondateur du Laboratoire de Graphique, on lui doit notamment : La Sémiologie Graphique (1967, 1973, 2005), La Graphique et le traitement graphique de l'information (1977, six traductions, diverses procédures graphiques automatiques et de nombreuses cartes et projections devenues classiques. L'invention de la sémiologie graphique s'ancre dans une formation classique puisque Jacques Bertin fait partie des premières générations d'élèves de l'École de cartographie créée en 1934. Au début des années cinquante, Jacques Bertin, jeune chercheur au CNRS, rejoint une équipe pluridisciplinaire dirigée par le sociologue Paul-Henri Chombart de Lauwe qui mène une étude sur l'espace social de la région parisienne. A cette époque, Jacques Bertin, chargé de la recherche graphique, veut résumer l'expression graphique en «quelques règles simples, confirmées par l'expérience, auxquelles s'ajouteraient un peu de technique et de l'esprit critique». Son approche est marquée par l'expansion de la sémiotique des années 1970 dans la lignée des travaux de Saussure dans son Cours de linguistique générale (1911). Quelque peu oublié dans son pays d'origine (les rééditions françaises se sont longtemps fait attendre), cette sémiologie du graphisme est souvent citée dans les travaux américains.
Statistical maps --- Information visualization --- Sémiologie --- --Maps, Statistical --- Théorie de l'information --- Semiotics --- Graphic methods --- Statistics --- Cartographie --- Communication visuelle --- Statistique --- Statistics - Graphic methods --- Maps, Statistical
Book
ISBN: 9789027207104 9027260982 9789027260987 9789027207098 9027207097 9027207100 Year: 2020 Publisher: Philadelphia John Benjamins Publishing Company
Abstract | Keywords | Export | Availability | Bookmark
 Loading...
Choose an application
- Reference Manager
- EndNote
- RefWorks (Direct export to RefWorks)
"This book is a textbook on R, a programming language and environment for statistical analysis and visualization. Its primary aim is to introduce R as a research instrument in quantitative Interactional Linguistics. Focusing on visualization in R, the book presents original case studies on conversational talk-in-interaction based on corpus data and explains in good detail how key graphs in the case studies were programmed in R. It also includes task sections to enable readers to conduct their own research and compute their own visualizations in R. Both the code underlying the key graphs in the case studies and the datasets used in the case studies as well as in the task sections are made available on the book's companion website"--
Computational linguistics. --- Conversation analysis --- Discourse analysis --- Grammar, Comparative and general --- Information visualization. --- Linguistics --- R (Computer program language). --- Data processing. --- Syntax --- Statistical methods. --- E-books --- R (Computer program language) --- Information visualization --- Statistical methods --- Mathematical linguistics --- Lingüística --- Lingüística matemática --- R (Lenguaje de programación) --- Lingüística e informática --- Análisis del discurso --- Métodos estadísiticos --- Proceso de datos --- Linguistics - Statistical methods
Book
ISBN: 9781526468925 9781526468932 152646893X 1526468921 Year: 2019 Publisher: London : Sage,
Abstract | Keywords | Export | Availability | Bookmark
 Loading...
Choose an application
- Reference Manager
- EndNote
- RefWorks (Direct export to RefWorks)
Charts, diagrams, etc. --- Information visualization. --- Methods in social research (general) --- Statistical science --- Artificial intelligence. Robotics. Simulation. Graphics --- Information visualization --- Statistics --- Visual communication. --- Graphic arts --- Data --- Data visualisation --- Visual communication --- Diagrams, Statistical --- Statistical diagrams --- Data visualization --- Visualization of information --- Information science --- Visual analytics --- Graphic communication --- Imaginal communication --- Pictorial communication --- Communication --- Statistical analysis --- Statistical data --- Statistical methods --- Mathematics --- Econometrics --- visualisatie van informatie --- visuele communicatie --- statistiek --- Information visualization - Handbooks, manuals, etc. --- Statistics - Charts, diagrams, etc. --- Graphic arts - Handbooks, manuals, etc. --- Graphic signs --- Documentation and information --- Mass communications --- Computer. Automation --- grafische communicatie --- datavisualisatie --- grafische vormgeving --- Graphic arts. --- Data visualisation. --- Arts graphiques. --- Communication visuelle.
Multi
ISBN: 9780500239186 Year: 2014 Publisher: New York, New York Thames & Hudson
Abstract | Keywords | Export | Availability | Bookmark
 Loading...
Choose an application
- Reference Manager
- EndNote
- RefWorks (Direct export to RefWorks)
Graphic arts --- maps [documents] --- cartography [discipline] --- atlases --- Information visualization. --- Maps in art. --- Cartography. --- Visualisation de l'information --- Cartes dans l'art --- Cartographie --- cartografie --- topografie --- 754.46 --- kaarten --- diagrammen --- tabellen --- landkaarten --- grafische vormgeving, volgens thema, info/bewegwijzering

ISBN: 1589481240 Year: 2005 Publisher: Redlands, Calif. ESRI
Abstract | Keywords | Export | Availability | Bookmark
 Loading...
Choose an application
- Reference Manager
- EndNote
- RefWorks (Direct export to RefWorks)
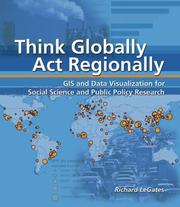
Giving social scientists and students a solid introduction to Geographical Information Systems (GIS), this study focuses on some of society's most pressing issues, including growth, pollution, and economic development. By calling upon such high-end analytical tools as Global Positioning System navigation and satellite imagery, GIS can be a critical tool in examining social problems. This study encourages readers to be visionary and even utopian in imagining better urban futures by concentrating on three related topics& urbanization, conflicts between natural and built environments, and regional equity. The introductory and spatial analysis chapters expand this understanding so that readers see both urban problems and urban opportunities more clearly.
Information systems --- Economic geography --- United States --- Computer graphics. --- Geographic information systems. --- Information visualization. --- Regional planning --- Urban ecology (Sociology) --- Urban ecology --- Urban geography --- Urban policy --- Geografie --- Data processing. --- Geografische Informatie Systemen --- Toepassingen. --- United States of America
| Listing 1 - 10 of 25 | << page >> |
Sort by
|

 Search
 Feedback
 About
About Help
Help News
News