| Listing 1 - 10 of 11 | << page >> |
Sort by
|
Book
ISBN: 9780521745833 9780521897587 9780511816109 9780511641374 0511641370 0511638930 9780511638930 9780511640018 0511640013 0511637861 9780511637865 0521897580 0511816103 0521745837 1107201896 1107086620 Year: 2009 Publisher: Cambridge : Cambridge University Press,
Abstract | Keywords | Export | Availability | Bookmark
 Loading...
Choose an application
- Reference Manager
- EndNote
- RefWorks (Direct export to RefWorks)
This combination of text and lab book presents an entirely different approach to structural geology. Designed for undergraduate laboratory classes, it provides a step-by-step guide for solving geometric problems arising from structural field observations. The book discusses both traditional methods and cutting-edge approaches, with emphasis given to graphical methods and visualization techniques that support students in tackling challenging two- and three-dimensional problems. Numerous exercises encourage practice in using the techniques, and demonstrate how field observations can be converted into useful information about geological structures and the processes responsible for creating them. This updated fourth edition incorporates new material on stress, deformation, strain and flow, and the underlying mathematics of the subject. With stereonet plots and solutions to the exercises available online at www.cambridge.org/ragan, this book is a key resource for undergraduates, advanced students and researchers wanting to improve their practical skills in structural geology.
Geology, Structural --- Geology, Structural. --- Geotectonics --- Structural geology --- Tectonics (Geology) --- Physical geology --- Geology --- Géomorphologie structurale --- Tectonique --- Géologie --- Graphic methods. --- Méthodes graphiques
Book
ISBN: 0253050693 Year: 1976 Publisher: Indiana University Press
Abstract | Keywords | Export | Availability | Bookmark
 Loading...
Choose an application
- Reference Manager
- EndNote
- RefWorks (Direct export to RefWorks)
Approaching linguistic science from the combined viewpoint of the philosophy of science and the theory of graphic design, this book offers a radically new treatment of linguistic theory and the history of linguistics. The author analyzes graphic representation, or diagramming, in terms of form and meaning, proposes a taxonomy of linguistic models that cuts across other classifications of linguistic theory, and shows that, like models in the biological and physical sciences, graphic representation has performed and continues to perform a heuristic function for the development of theory in linguistics. This view leads to a reinterpretation not only of the place and function of graphic representation in theoretical linguistics today but also of the history of linguistics. The book suggests new directions for models in linguistics: by making use of the tools furnished by the principles of graphic design, within the context of the principles of the philosophy of science, linguistics can exploit the influence of graphic representation on theory. This is illustrated by two new three-dimensional models for linguistics designed to replace the two principal models now current—the matrix and the tree—both two-dimensional. An analysis of the ways in which new models grow out of old ones and improve upon them demonstrates how graphic representation can furnish linguistics with models and how the design of such models can be improved by applying the principles of graphic design. The view presented here has particular significance for the development of transformational-generative theory.
Taalkunde. --- Modellen. --- Grafische voorstellingen. --- Linguistics --- Linguistic models. --- Modeles linguistiques. --- Linguistique --- Graphic methods. --- Methodes graphiques. --- Mathematical linguistics --- Models, Linguistic --- Typology (Linguistics)
Book
ISBN: 9780262013192 0262013193 Year: 2009 Publisher: Cambridge, MA : MIT Press,
Abstract | Keywords | Export | Availability | Bookmark
 Loading...
Choose an application
- Reference Manager
- EndNote
- RefWorks (Direct export to RefWorks)
informatietheorie --- entropie --- Artificial intelligence. Robotics. Simulation. Graphics --- algoritmen --- Mathematical statistics --- Actuarial mathematics --- Graphical modeling (Statistics) --- Bayesian statistical decision theory --- Graphic methods --- Graphic methods. --- Graphical modeling (Statistics). --- 519.2 --- Probability. Mathematical statistics --- 519.2 Probability. Mathematical statistics --- Multivariate analysis --- Bayes' solution --- Bayesian analysis --- Statistical decision --- STATISTIQUE MATHEMATIQUE --- ARTIFICIAL INTELLIGENCE --- METHODES GRAPHIQUES
Book
ISBN: 9783034801799 3034801793 9783034801805 3034801807 Year: 2012 Publisher: Basel : Springer Basel : Imprint: Birkhäuser,
Abstract | Keywords | Export | Availability | Bookmark
 Loading...
Choose an application
- Reference Manager
- EndNote
- RefWorks (Direct export to RefWorks)
This book provides a systematic introduction to functions of one complex variable. Its novel feature is the consistent use of special color representations – so-called phase portraits – which visualize functions as images on their domains. Reading Visual Complex Functions requires no prerequisites except some basic knowledge of real calculus and plane geometry. The text is self-contained and covers all the main topics usually treated in a first course on complex analysis. With separate chapters on various construction principles, conformal mappings and Riemann surfaces it goes somewhat beyond a standard programme and leads the reader to more advanced themes. In a second storyline, running parallel to the course outlined above, one learns how properties of complex functions are reflected in and can be read off from phase portraits. The book contains more than 200 of these pictorial representations which endow individual faces to analytic functions. Phase portraits enhance the intuitive understanding of concepts in complex analysis and are expected to be useful tools for anybody working with special functions – even experienced researchers may be inspired by the pictures to new and challenging questions. Visual Complex Functions may also serve as a companion to other texts or as a reference work for advanced readers who wish to know more about phase portraits.
Functions of complex variables --- 517.53 --- 517.53 Functions of a complex variable --- Functions of a complex variable --- Complex variables --- Elliptic functions --- Functions of real variables --- Graphic methods --- Graphic methods. --- Functions of complex variables. --- Functions, special. --- Functions of a Complex Variable. --- Special Functions. --- Special functions --- Mathematical analysis --- Special functions. --- Fonctions d'une variable complexe --- Methodes graphiques

ISBN: 9780387681207 0387345426 9780387345420 0387964266 0387681205 9780387964263 Year: 2007 Publisher: New York, NY : Springer New York : Imprint: Springer,
Abstract | Keywords | Export | Availability | Bookmark
 Loading...
Choose an application
- Reference Manager
- EndNote
- RefWorks (Direct export to RefWorks)
Praise for George Francis's A Topological Picturebook: Bravo to Springer for reissuing this unique and beautiful book! It not only reminds the older generation of the pleasures of doing mathematics by hand, but also shows the new generation what ``hands on'' really means. - John Stillwell, University of San Francisco The Topological Picturebook has taught a whole generation of mathematicians to draw, to see, and to think. - Tony Robbin, artist and author of Shadows of Reality: The Fourth Dimension in Relativity, Cubism, and Modern Thought The classic reference for how to present topological information visually, full of amazing hand-drawn pictures of complicated surfaces. - John Sullivan, Technische Universitat Berlin A Topological Picturebook lets students see topology as the original discoverers conceived it: concrete and visual, free of the formalism that burdens conventional textbooks. - Jeffrey Weeks, author of The Shape of Space A Topological Picturebook is a visual feast for anyone concerned with mathematical images. Francis provides exquisite examples to build one's "visualization muscles". At the same time, he explains the underlying principles and design techniques for readers to create their own lucid drawings. - George W. Hart, Stony Brook University In this collection of narrative gems and intriguing hand-drawn pictures, George Francis demonstrates the chicken-and-egg relationship, in mathematics, of image and text. Since the book was first published, the case for pictures in mathematics has been won, and now it is time to reflect on their meaning. A Topological Picturebook remains indispensable. - Marjorie Senechal, Smith College and co-editor of the Mathematical Intelligencer.
Mathematics. --- Topology. --- Geometry. --- Mathématiques --- Géométrie --- Topologie --- Topology --- Mathematics --- Physical Sciences & Mathematics --- Geometry --- Graphic methods --- Analysis situs --- Position analysis --- Rubber-sheet geometry --- Graphic methods. --- Topologie. Méthodes graphiques. --- Topologie. Grafische methoden. --- Polyhedra --- Set theory --- Algebras, Linear --- Euclid's Elements --- Géometrie --- Infographie --- Topology - Graphic methods.

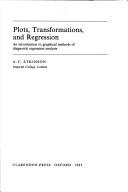
ISBN: 0198533594 0198533713 9780198533719 9780198533597 Year: 1987 Volume: 1 Publisher: Oxford : Clarendon Press,
Abstract | Keywords | Export | Availability | Bookmark
 Loading...
Choose an application
- Reference Manager
- EndNote
- RefWorks (Direct export to RefWorks)
Regression analysis --- Analyse de régression --- 519.536 --- 519.235 --- 519.235 Statistics of dependent variables. Contingency tables --- Statistics of dependent variables. Contingency tables --- #ABIB:aeco --- regressie-analyse --- Analysis, Regression --- Linear regression --- Regression modeling --- Multivariate analysis --- Structural equation modeling --- Mathematical statistics --- Regression Analysis --- Regression analysis. --- 303.5 --- AA / International- internationaal --- Theorie van correlatie en regressie. (OLS, adjusted LS, weighted LS, restricted LS, GLS, SLS, LIML, FIML, maximum likelihood). Parametric and non-parametric methods and theory (wiskundige statistiek) --- Modèles linéaires (statistique) --- Statistique mathematique --- Regression --- Methodes graphiques
Book
ISBN: 9780387981406 9780387981413 0387981403 038798142X 9786612509919 1282509918 0387981411 Year: 2009 Publisher: New York, NY : Springer New York : Imprint: Springer,
Abstract | Keywords | Export | Availability | Bookmark
 Loading...
Choose an application
- Reference Manager
- EndNote
- RefWorks (Direct export to RefWorks)
This book describes ggplot2, a new data visualization package for R that uses the insights from Leland Wilkison's Grammar of Graphics to create a powerful and flexible system for creating data graphics. With ggplot2, it's easy to: produce handsome, publication-quality plots, with automatic legends created from the plot specification superpose multiple layers (points, lines, maps, tiles, box plots to name a few) from different data sources, with automatically adjusted common scales add customisable smoothers that use the powerful modelling capabilities of R, such as loess, linear models, generalised additive models and robust regression save any ggplot2 plot (or part thereof) for later modification or reuse create custom themes that capture in-house or journal style requirements, and that can easily be applied to multiple plots approach your graph from a visual perspective, thinking about how each component of the data is represented on the final plot This book will be useful to everyone who has struggled with displaying their data in an informative and attractive way. You will need some basic knowledge of R (i.e. you should be able to get your data into R), but ggplot2 is a mini-language specifically tailored for producing graphics, and you'll learn everything you need in the book. After reading this book you'll be able to produce graphics customized precisely for your problems, and you'll find it easy to get graphics out of your head and on to the screen or page. Hadley Wickham is an Assistant Professor of Statistics at Rice University, and is interested in developing computational and cognitive tools for making data preparation, visualization, and analysis easier. He has developed 15 R packages and in 2006 he won the John Chambers Award for Statistical Computing for his work on the ggplot and reshape R packages.
Mathematical statistics --- Graphic methods --- R (Computer program language) --- Méthodes graphiques --- R (Langage de programmation) --- Graphic methods. --- Datenanalyse. --- Graphische Darstellung. --- Plot (Graphische Darstellung) --- R (Programm) --- Visualisierung. --- 001.4226 --- GNU-S (Computer program language) --- Domain-specific programming languages --- Graphics --- Graphs --- Geometrical drawing --- Least squares --- Mathematics --- Mechanical drawing --- Methoden en technieken --- statistiek --- R (Computer program language). --- Mathematical Statistics --- Elementary Mathematics & Arithmetic --- Physical Sciences & Mathematics --- Plot (Graphische Darstellung). --- R (Programm). --- statistiek. --- Méthodes graphiques --- EPUB-LIV-FT LIVMATHE LIVSTATI SPRINGER-B --- Mathematical statistics. --- Visualization. --- Computer graphics. --- Statistics and Computing/Statistics Programs. --- Computer Graphics. --- Datenanalyse --- Graphische Darstellung --- Visualisierung --- Visualisation --- Imagination --- Visual perception --- Imagery (Psychology) --- Statistical inference --- Statistics, Mathematical --- Statistics --- Probabilities --- Sampling (Statistics) --- Automatic drafting --- Graphic data processing --- Graphics, Computer --- Computer art --- Graphic arts --- Electronic data processing --- Engineering graphics --- Image processing --- Statistical methods --- Digital techniques --- Statistics . --- Mathematics. --- Math --- Science --- Statistical analysis --- Statistical data --- Statistical science --- Econometrics

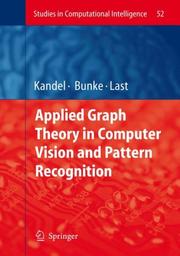
ISBN: 9783540680192 3540680195 9786610853052 1280853050 3540680209 Year: 2007 Volume: 52 Publisher: Berlin, Germany ; New York, United States : Springer,
Abstract | Keywords | Export | Availability | Bookmark
 Loading...
Choose an application
- Reference Manager
- EndNote
- RefWorks (Direct export to RefWorks)
This book will serve as a foundation for a variety of useful applications of graph theory to computer vision, pattern recognition, and related areas. It covers a representative set of novel graph-theoretic methods for complex computer vision and pattern recognition tasks. The first part of the book presents the application of graph theory to low-level processing of digital images such as a new method for partitioning a given image into a hierarchy of homogeneous areas using graph pyramids, or a study of the relationship between graph theory and digital topology. Part II presents graph-theoretic learning algorithms for high-level computer vision and pattern recognition applications, including a survey of graph based methodologies for pattern recognition and computer vision, a presentation of a series of computationally efficient algorithms for testing graph isomorphism and related graph matching tasks in pattern recognition and a new graph distance measure to be used for solving graph matching problems. Finally, Part III provides detailed descriptions of several applications of graph-based methods to real-world pattern recognition tasks. It includes a critical review of the main graph-based and structural methods for fingerprint classification, a new method to visualize time series of graphs, and potential applications in computer network monitoring and abnormal event detection.
Computer vision --- Pattern recognition systems --- Graph theory --- Vision par ordinateur --- Reconnaissance des formes (Informatique) --- Théorie des graphes --- Graphic methods --- Méthodes graphiques --- Computer vision -- Graphic methods. --- Electronic books. -- local. --- Graph theory. --- Pattern recognition systems -- Graphic methods. --- Engineering & Applied Sciences --- Civil & Environmental Engineering --- Applied Mathematics --- Civil Engineering --- Applied Physics --- Graphic methods. --- Théorie des graphes --- Méthodes graphiques --- EPUB-LIV-FT SPRINGER-B --- Graphs, Theory of --- Theory of graphs --- Pattern classification systems --- Pattern recognition computers --- Machine vision --- Vision, Computer --- Extremal problems --- Engineering. --- Artificial intelligence. --- Applied mathematics. --- Engineering mathematics. --- Appl.Mathematics/Computational Methods of Engineering. --- Artificial Intelligence (incl. Robotics). --- Combinatorial analysis --- Topology --- Pattern perception --- Artificial intelligence --- Image processing --- Mathematical and Computational Engineering. --- Artificial Intelligence. --- AI (Artificial intelligence) --- Artificial thinking --- Electronic brains --- Intellectronics --- Intelligence, Artificial --- Intelligent machines --- Machine intelligence --- Thinking, Artificial --- Bionics --- Cognitive science --- Digital computer simulation --- Electronic data processing --- Logic machines --- Machine theory --- Self-organizing systems --- Simulation methods --- Fifth generation computers --- Neural computers --- Engineering --- Engineering analysis --- Mathematical analysis --- Mathematics

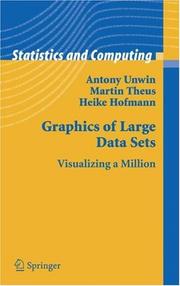
ISBN: 0387329064 9780387329062 9786610938421 1280938420 0387379770 Year: 2006 Publisher: New York, NY : Springer New York : Imprint: Springer,
Abstract | Keywords | Export | Availability | Bookmark
 Loading...
Choose an application
- Reference Manager
- EndNote
- RefWorks (Direct export to RefWorks)
Graphics are great for exploring data, but how can they be used for looking at the large datasets that are commonplace to-day? This book shows how to look at ways of visualizing large datasets, whether large in numbers of cases or large in numbers of variables or large in both. Data visualization is useful for data cleaning, exploring data, identifying trends and clusters, spotting local patterns, evaluating modeling output, and presenting results. It is essential for exploratory data analysis and data mining. Data analysts, statisticians, computer scientists-indeed anyone who has to explore a large dataset of their own-should benefit from reading this book. New approaches to graphics are needed to visualize the information in large datasets and most of the innovations described in this book are developments of standard graphics. There are considerable advantages in extending displays which are well-known and well-tried, both in understanding how best to make use of them in your work and in presenting results to others. It should also make the book readily accessible for readers who already have a little experience of drawing statistical graphics. All ideas are illustrated with displays from analyses of real datasets and the authors emphasize the importance of interpreting displays effectively. Graphics should be drawn to convey information and the book includes many insightful examples. Antony Unwin holds the Chair of Computer Oriented Statistics and Data Analysis at the University of Augsburg. He has been involved in developing visualization software for twenty years. Martin Theus is a Senior Researcher at the University of Augsburg, has worked in industry and research in both Germany and the USA, and is the author of the visualization software Mondrian. Heike Hofmann is Assistant Professor of Statistics at Iowa State University. She wrote the software MANET and has also cooperated in the development of the GGobi software.
Artificial intelligence. Robotics. Simulation. Graphics --- Information systems --- QA 276.3 Graphic methods --- Computational Science & Engineering --- Computational Statistics --- Computer Imaging, Graphics & Vision --- Computer Science --- Statistics --- Computer graphics. --- Statistique --- Infographie --- Graphic methods. --- Méthodes graphiques --- Computer graphics --- Graphic methods --- Statistics -- Graphic methods. --- Mathematics --- Physical Sciences & Mathematics --- Mathematical Statistics --- Méthodes graphiques --- EPUB-LIV-FT LIVSTATI SPRINGER-B --- Automatic drafting --- Graphic data processing --- Graphics, Computer --- Diagrams, Statistical --- Statistical diagrams --- Mathematics. --- Operations research. --- Decision making. --- Data mining. --- Visualization. --- Computer software. --- Statistics. --- Mathematical Software. --- Statistical Theory and Methods. --- Data Mining and Knowledge Discovery. --- Operation Research/Decision Theory. --- Computer Graphics. --- Computer art --- Graphic arts --- Electronic data processing --- Engineering graphics --- Image processing --- Statistical analysis --- Statistical data --- Statistical methods --- Statistical science --- Econometrics --- Software, Computer --- Computer systems --- Visualisation --- Imagery (Psychology) --- Imagination --- Visual perception --- Algorithmic knowledge discovery --- Factual data analysis --- KDD (Information retrieval) --- Knowledge discovery in data --- Knowledge discovery in databases --- Mining, Data --- Database searching --- Deciding --- Decision (Psychology) --- Decision analysis --- Decision processes --- Making decisions --- Management --- Management decisions --- Choice (Psychology) --- Problem solving --- Operational analysis --- Operational research --- Industrial engineering --- Management science --- Research --- System theory --- Math --- Science --- Digital techniques --- Decision making --- Curve fitting --- Mathematical statistics. --- Operations Research/Decision Theory. --- Statistical inference --- Statistics, Mathematical --- Probabilities --- Sampling (Statistics) --- Statistics . --- Statistics - Graphic methods

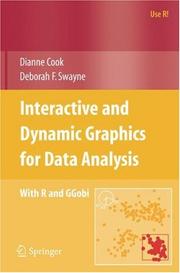
ISBN: 9780387717616 0387717617 9786611067069 1281067067 0387717625 Year: 2007 Publisher: New York, NY : Springer New York : Imprint: Springer,
Abstract | Keywords | Export | Availability | Bookmark
 Loading...
Choose an application
- Reference Manager
- EndNote
- RefWorks (Direct export to RefWorks)
This richly illustrated book describes the use of interactive and dynamic graphics as part of multidimensional data analysis. Chapters include clustering, supervised classification, and working with missing values. A variety of plots and interaction methods are used in each analysis, often starting with brushing linked low-dimensional views and working up to manual manipulation of tours of several variables. The role of graphical methods is shown at each step of the analysis, not only in the early exploratory phase, but in the later stages, too, when comparing and evaluating models. All examples are based on freely available software: GGobi for interactive graphics and R for static graphics, modeling, and programming. The printed book is augmented by a wealth of material on the web, encouraging readers follow the examples themselves. The web site has all the data and code necessary to reproduce the analyses in the book, along with movies demonstrating the examples. The book may be used as a text in a class on statistical graphics or exploratory data analysis, for example, or as a guide for the independent learner. Each chapter ends with a set of exercises. The authors are both Fellows of the American Statistical Association, past chairs of the Section on Statistical Graphics, and co-authors of the GGobi software. Dianne Cook is Professor of Statistics at Iowa State University. Deborah Swayne is a member of the Statistics Research Department at AT&T Labs.
Programming --- Artificial intelligence. Robotics. Simulation. Graphics --- Mathematical statistics --- Statistics --- Visualization --- Computer graphics --- R (Computer program language) --- Statistique --- Visualisation --- Infographie --- R (Langage de programmation) --- Graphic methods --- Congresses --- Méthodes graphiques --- Congrès --- Computer graphics. --- Graphic methods. --- Mathematical statistics -- Graphic methods. --- R (Computer program language). --- Statistics -- Graphic methods. --- Statistics --Graphic methods. --- Visualization -- Congresses. --- Visualization --Congresses. --- Mathematics --- Physical Sciences & Mathematics --- Mathematical Statistics --- -Visualization --- -R (Computer program language) --- 006.6 --- GNU-S (Computer program language) --- Domain-specific programming languages --- Imagery (Psychology) --- Imagination --- Visual perception --- Statistical analysis --- Statistical data --- Statistical methods --- Statistical science --- Econometrics --- Automatic drafting --- Graphic data processing --- Graphics, Computer --- Computer art --- Graphic arts --- Electronic data processing --- Engineering graphics --- Image processing --- Graphics --- Graphs --- Geometrical drawing --- Least squares --- Mechanical drawing --- Digital techniques --- Diagrams, Statistical --- Statistical diagrams --- Mathematical statistics. --- Data mining. --- Bioinformatics. --- Visualization. --- Statistical Theory and Methods. --- Statistics and Computing/Statistics Programs. --- Data Mining and Knowledge Discovery. --- Curve fitting --- Bio-informatics --- Biological informatics --- Biology --- Information science --- Computational biology --- Systems biology --- Algorithmic knowledge discovery --- Factual data analysis --- KDD (Information retrieval) --- Knowledge discovery in data --- Knowledge discovery in databases --- Mining, Data --- Database searching --- Statistical inference --- Statistics, Mathematical --- Probabilities --- Sampling (Statistics) --- Data processing --- Statistics . --- Mathematics. --- Math --- Science
| Listing 1 - 10 of 11 | << page >> |
Sort by
|

 Search
 Feedback
 About
About Help
Help News
News