| Listing 1 - 10 of 14 | << page >> |
Sort by
|
Book
ISBN: 9781324001560 1324001569 Year: 2019 Publisher: New York, NY W. W. Norton & Company, Inc.
Abstract | Keywords | Export | Availability | Bookmark
 Loading...
Choose an application
- Reference Manager
- EndNote
- RefWorks (Direct export to RefWorks)
"A leading data visualization expert explores the negative--and positive--influences that charts have on our perception of truth. We've all heard that a picture is worth a thousand words, but what if we don't understand what we're looking at? Social media has made charts, infographics, and diagrams ubiquitous--and easier to share than ever. While such visualizations can better inform us, they can also deceive by displaying incomplete or inaccurate data, suggesting misleading patterns-- or simply misinform us by being poorly designed, such as the confusing "eye of the storm" maps shown on TV every hurricane season. Many of us are ill equipped to interpret the visuals that politicians, journalists, advertisers, and even employers present each day, enabling bad actors to easily manipulate visuals to promote their own agendas. Public conversations are increasingly driven by numbers, and to make sense of them we must be able to decode and use visual information. By examining contemporary examples ranging from election-result infographics to global GDP maps and box-office record charts, How Charts Lie teaches us how to do just that"--
Computer graphics --- Charts, diagrams, etc - Design --- Information visualization --- Social media --- 303.0 --- 302 --- Statistische technieken in econometrie. Wiskundige statistiek (algemene werken en handboeken) --- Opmaak en presentatie van statistische reeksen en tabellen. Grafieken --- Charts, diagrams, etc
ISBN: 0823015726 Year: 2000 Publisher: New York, N.Y. Watson-Guptill
Abstract | Keywords | Export | Availability | Bookmark
 Loading...
Choose an application
- Reference Manager
- EndNote
- RefWorks (Direct export to RefWorks)
Charts, diagrams, etc --- Mathematical statistics --- #PBIB:2004.1 --- 654 --- AA / International- internationaal --- Mathematics --- Statistical inference --- Statistics, Mathematical --- Diagrams, charts, etc. --- Graphs --- Plots (Diagrams) --- Data processing --- Graphic methods --- Informatieverwerking. Bureautica --- Statistical methods --- Statistical science --- Artificial intelligence. Robotics. Simulation. Graphics --- Statistics --- Probabilities --- Sampling (Statistics)
ISBN: 0195135326 9780195135329 9780199772254 0190285605 0199772258 9786610834327 1280834323 Year: 1999 Publisher: Oxford Oxford university press
Abstract | Keywords | Export | Availability | Bookmark
 Loading...
Choose an application
- Reference Manager
- EndNote
- RefWorks (Direct export to RefWorks)
This beautifully illustrated book is the first complete handbook to visual information. Well written, easy use, and carefully indexed, it describes the full range of charts, graphs, maps, diagrams, and tables used daily to manage, analyse, and communicate information. It features over 3,000 illustrations, making it an ideal source for ideas on how to present information. It is an invaluable tool for anyone who writes or designs reports, whether for scientific journals, annual reports, or magazines and newspapers.
Artificial intelligence. Robotics. Simulation. Graphics --- Graphic signs --- scientific illustrations [images] --- grafieken --- wetenschappelijke illustraties --- grafische communicatie --- visualisatie --- Charts, diagrams, etc --- Computer graphics --- Graphic methods --- 655.26 --- computergrafiek --- grafische vormgeving --- webdesign --- #PBIB:2004.1 --- 302 --- 654 --- AA / International- internationaal --- Graphics --- Graphs --- Geometrical drawing --- Least squares --- Mathematics --- Mechanical drawing --- Automatic drafting --- Graphic data processing --- Graphics, Computer --- Computer art --- Graphic arts --- Electronic data processing --- Engineering graphics --- Image processing --- Diagrams, charts, etc. --- Plots (Diagrams) --- grafische vormgeving, typografie --- Opmaak en presentatie van statistische reeksen en tabellen. Grafieken --- Informatieverwerking. Bureautica --- Digital techniques --- Charts, diagrams, etc. --- Computer graphics.
ISBN: 0471047244 9780471047247 Year: 1979 Publisher: New York (N.Y.): Wiley
Abstract | Keywords | Export | Availability | Bookmark
 Loading...
Choose an application
- Reference Manager
- EndNote
- RefWorks (Direct export to RefWorks)
Statistical science --- Statistics --- Statistique --- Graphic methods --- Méthodes graphiques --- -AA / International- internationaal --- 302 --- Statistical analysis --- Statistical data --- Statistical methods --- Mathematics --- Econometrics --- Opmaak en presentatie van statistische reeksen en tabellen. Grafieken. --- AA / International- internationaal --- Diagrams, Statistical --- Statistical diagrams --- Curve fitting --- Opmaak en presentatie van statistische reeksen en tabellen. Grafieken --- Graphic methods. --- Statistics - Graphic methods
ISBN: 0387963138 1461293715 1461249503 Year: 1986 Publisher: New York (N.Y.): Springer
Abstract | Keywords | Export | Availability | Bookmark
 Loading...
Choose an application
- Reference Manager
- EndNote
- RefWorks (Direct export to RefWorks)
Mathematical statistics --- Statistics --- Statistique --- Graphic methods --- Méthodes graphiques --- -#SBIB:303H71 --- #SBIB:303H510 --- Statistical analysis --- Statistical data --- Statistical methods --- Statistical science --- Mathematics --- Econometrics --- Methoden sociale wetenschappen: voorstelling van gegevens --- Methoden sociale wetenschappen: statistische technieken, algemeen --- Graphic methods. --- -Statistical analysis --- Méthodes graphiques --- Diagrams, Statistical --- Statistical diagrams --- Curve fitting
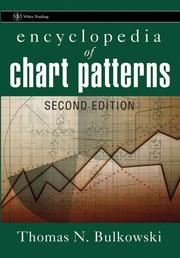
ISBN: 0471668265 1118045858 9786610275885 128027588X 0471722251 9780471722250 9780471668268 9781118045855 6610275882 Year: 2005 Publisher: Hoboken, NJ : John Wiley,
Abstract | Keywords | Export | Availability | Bookmark
 Loading...
Choose an application
- Reference Manager
- EndNote
- RefWorks (Direct export to RefWorks)
In this revised and expanded second edition of the bestselling Encyclopedia of Chart Patterns, Thomas Bulkowski updates the classic with new performance statistics for both bull and bear markets and 23 new patterns, including a second section devoted to ten event patterns. Bulkowski tells you how to trade the significant events -- such as quarterly earnings announcements, retail sales, stock upgrades and downgrades -- that shape today's trading and uses statistics to back up his approach. This comprehensive new edition is a must-have reference if you're a technical investor or trader."--Provided by publisher.
Commodity futures. --- Commodity futures --Charts, diagrams, etc. --- Investment analysis. --- Stocks. --- Stocks --Charts, diagrams, etc. --- Stocks --- Commodity futures --- Investment analysis --- Finance --- Business & Economics --- Investment & Speculation --- Analysis of investments --- Analysis of securities --- Security analysis --- Commodities futures --- Commodity futures contracts --- Commodity futures trading --- Futures, Commodity --- Futures --- E-books

ISBN: 0470139501 1119108179 9786611222345 1281222348 0470267968 9780470267967 9780470139509 9781281222343 6611222340 Year: 2008 Publisher: Hoboken, N.J. : John Wiley & Sons,
Abstract | Keywords | Export | Availability | Bookmark
 Loading...
Choose an application
- Reference Manager
- EndNote
- RefWorks (Direct export to RefWorks)
The Wall Street Waltz Introducing the new Fisher Investment Series Comprised of engaging and informative titles written by renowned money manager and bestselling author Ken Fisher, this series offers essential insights into the worlds of investing and finance.""Any investor who fails to read and heed Ken Fisher's book will have only himself (or herself) to blame if he loses his shirt in the market. Using simple words and dramatic charts, Fisher packs a whole financial education into one neat package.""James W. Michaels, Editor Emeritus and Group Vice President-Editorial,
Economic indicators - United States. --- Interest rates - United States. --- Stocks - United States. --- Stocks. --- Stocks --- Interest rates --- Economic indicators --- Investment & Speculation --- Finance --- Business & Economics --- Business indicators --- Indicators, Business --- Indicators, Economic --- Leading indicators --- Money market rates --- Rate of interest --- Rates, Interest --- Common shares --- Common stocks --- Equities --- Equity capital --- Equity financing --- Shares of stock --- Stock issues --- Stock offerings --- Stock trading --- Trading, Stock --- Economic history --- Quality of life --- Economic forecasting --- Index numbers (Economics) --- Social indicators --- Interest --- Securities --- Bonds --- Corporations --- Going public (Securities) --- Stock repurchasing --- Stockholders --- E-books --- Stocks - United States - Charts, diagrams, etc. --- Interest rates - United States - Charts, diagrams, etc. --- Economic indicators - United States - Charts, diagrams, etc.

ISBN: 2909356264 9782909356266 Year: 2002 Publisher: Hendaye Valor
Abstract | Keywords | Export | Availability | Bookmark
 Loading...
Choose an application
- Reference Manager
- EndNote
- RefWorks (Direct export to RefWorks)
AA / International- internationaal --- 339.42 --- Financiële analyse. --- Investment analysis --- Stock price forecasting --- Stocks --- Terminology --- Prices --- Financiële analyse --- Investment analysis - Terminology --- Stock price forecasting - Terminology --- Stocks - Prices - Charts, diagrams, etc. --- Analyse boursière

ISBN: 0761905987 0761905995 9780761905998 Year: 1996 Publisher: Thousand Oaks, Calif. Sage
Abstract | Keywords | Export | Availability | Bookmark
 Loading...
Choose an application
- Reference Manager
- EndNote
- RefWorks (Direct export to RefWorks)
Statistical science --- Statistics --- Statistique --- Graphic methods --- Méthodes graphiques --- Graphic methods. --- 311.218 --- #SBIB:303H71 --- AA / International- internationaal --- 302 --- Grafische voorstellingen van statistieken --- Methoden sociale wetenschappen: voorstelling van gegevens --- Opmaak en presentatie van statistische reeksen en tabellen. Grafieken. --- 311.218 Grafische voorstellingen van statistieken --- Méthodes graphiques --- Diagrams, Statistical --- Statistical diagrams --- Curve fitting --- Opmaak en presentatie van statistische reeksen en tabellen. Grafieken --- Statistics - Graphic methods --- Statistics. Graphic methods
Book
ISBN: 9781848441606 1848441606 Year: 2010 Publisher: Cheltenham Elgar
Abstract | Keywords | Export | Availability | Bookmark
 Loading...
Choose an application
- Reference Manager
- EndNote
- RefWorks (Direct export to RefWorks)
Economics --- Economie politique --- Charts, diagrams, etc. --- Tableaux, graphiques, etc. --- History --- AA / International- internationaal --- 303.0 --- 302 --- 033.2 --- Statistische technieken in econometrie. Wiskundige statistiek (algemene werken en handboeken). --- Opmaak en presentatie van statistische reeksen en tabellen. Grafieken. --- Economische en sociale encyclopedieën. --- Economic theory --- Political economy --- Social sciences --- Economic man --- Economische en sociale encyclopedieën --- Opmaak en presentatie van statistische reeksen en tabellen. Grafieken --- Statistische technieken in econometrie. Wiskundige statistiek (algemene werken en handboeken) --- Economics - Charts, diagrams, etc. --- Economics - History
| Listing 1 - 10 of 14 | << page >> |
Sort by
|

 Search
 Feedback
 About UniCat
  Help
Help News
News