| Listing 1 - 10 of 16 | << page >> |
Sort by
|
Book
Year: 2006 Publisher: New York Scientific American
Abstract | Keywords | Export | Availability | Bookmark
 Loading...
Choose an application
- Reference Manager
- EndNote
- RefWorks (Direct export to RefWorks)
QA 3 Collected works (nonserial) --- QA 3 Collected works (nonserial) --- QA 3 Collected works (nonserial) --- Mathematics --- Mathematics --- Mathematics

ISBN: 9780743254236 Year: 2002 Publisher: London Simon and Schuster
Abstract | Keywords | Export | Availability | Bookmark
 Loading...
Choose an application
- Reference Manager
- EndNote
- RefWorks (Direct export to RefWorks)
Mathematics --- Mathematics --- Mathematics --- Statistics --- Statistics --- Statistics --- Uncertainty --- Uncertainty --- Uncertainty --- QA 273 Probabilities --- QA 273 Probabilities --- QA 273 Probabilities
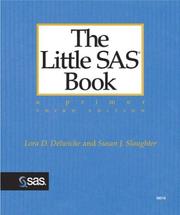
ISBN: 9781590473337 1590473337 Year: 2003 Publisher: Cary, NC SAS Institute
Abstract | Keywords | Export | Availability | Bookmark
 Loading...
Choose an application
- Reference Manager
- EndNote
- RefWorks (Direct export to RefWorks)
Getting started with SAS is easy with The Little SAS Book. This friendly, easy-to-read guide gently introduces you to the most commonly used features of SAS software plus a whole lot more! The book has been revised to include concepts of the Output Delivery System; the STYLE= option in the PRINT, REPORT, and TABULATE procedures; ODS HTML, RTF, PRINTER, and OUTPUT destinations; PROC REPORT; more on PROC TABULATE; exporting data; and the colon modifier for informats. You'll find clear and concise explanations of basic SAS concepts (such as DATA and PROC steps), inputting data, modifying and combining data sets, summarizing and presenting data, basic statistical procedures, and debugging SAS programs. Each topic is presented in a self-contained, two-page layout complete with examples and graphics. This format enables new users to get up and running quickly, while the examples allow you to type in the program and see it work!
QA 76.755 - Computer Software. Handbook --- SAS --- Mathematical statistics --- Data processing. --- -519.50285 --- 005.5 --- Mathematics --- Statistical inference --- Statistics, Mathematical --- Statistics --- Probabilities --- Sampling (Statistics) --- Data processing --- Statistical methods --- SAS (Computer file) --- Statistical analysis system --- SAS system --- 681.3*G --- 681.3*G Mathematics of computing --- Mathematics of computing --- Programming
Book
ISBN: 9781597181068 1597181064 Year: 2012 Publisher: College Station, Tex. Stata Press
Abstract | Keywords | Export | Availability | Bookmark
 Loading...
Choose an application
- Reference Manager
- EndNote
- RefWorks (Direct export to RefWorks)
Statistics --- Computer Graphics --- Social sciences --- QA 276.4 Mathematical statistics. Data processing --- 681.3*G --- Mathematics of computing --- 681.3*G Mathematics of computing --- Statistical analysis --- Statistical data --- Statistical methods --- Statistical science --- Mathematics --- Econometrics --- Behavioral sciences --- Human sciences --- Sciences, Social --- Social science --- Social studies --- Civilization --- Statistics&delete& --- Graphic methods&delete& --- Computer programs --- Stata. --- Sciences sociales --- Graphic methods --- Computer programs. --- Méthodes graphiques --- Statistiques. --- Logigrammes --- Méthodes statistiques.
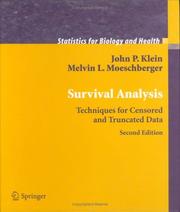
ISBN: 9781441929853 9780387216454 038795399X 9780387953991 Year: 2003 Publisher: New York ; Berlin ; Tokyo Springer
Abstract | Keywords | Export | Availability | Bookmark
 Loading...
Choose an application
- Reference Manager
- EndNote
- RefWorks (Direct export to RefWorks)
Mathematical statistics --- Survival analysis (Biometry) --- 51-7 --- 519.22 --- 51-7 Mathematical studies and methods in other sciences. Scientific mathematics. Actuarial mathematics. Biometrics. Econometrics etc. --- Mathematical studies and methods in other sciences. Scientific mathematics. Actuarial mathematics. Biometrics. Econometrics etc. --- Analysis, Survival (Biometry) --- Survivorship analysis (Biometry) --- Biometry --- Failure time data analysis --- 519.22 Statistical theory. Statistical models. Mathematical statistics in general --- Statistical theory. Statistical models. Mathematical statistics in general --- Survival analysis (Biometry). --- Analyse de la survie (Biométrie) --- EPUB-LIV-FT SPRINGER-B --- WA 950 Theory or methods of medical statistics
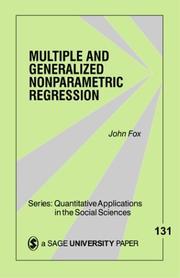
ISBN: 0761915850 1412985307 1452214506 0585212260 9780761915850 Year: 2000 Volume: 130 Publisher: London, Thousand Oaks, Calif., New Delhi Sage Publications
Abstract | Keywords | Export | Availability | Bookmark
 Loading...
Choose an application
- Reference Manager
- EndNote
- RefWorks (Direct export to RefWorks)
While regression analysis traces the dependence of the distribution of a response variable to see if it bears a particular (linear) relationship to one or more of the predictors, nonparametric regression analysis makes minimal assumptions about the form of relationship between the average response and the predictors. This makes nonparametric regression a more useful technique for analyzing data in which there are several predictors that may combine additively to influence the response. (An example could be something like birth order/gender/and temperament on achievement motivation). Unfortunately, researchers have not had accessible information on nonparametric regression analysisuntil now. Beginning with presentation of nonparametric regression based on dividing the data into bins and averaging the response values in each bin, Fox introduces readers to the techniques of kernel estimation, additive nonparametric regression, and the ways nonparametric regression can be employed to select transformations of the data preceding a linear least-squares fit. The book concludes with ways nonparametric regression can be generalized to logit, probit, and Poisson regression.
Mathematical statistics --- QA 278.2 .H67 2000 Regression analysis. Correlation analysis --- Regression analysis --- Nonparametric statistics --- #SBIB:303H10 --- #PBIB:2003.3 --- Analysis, Regression --- Linear regression --- Regression modeling --- Multivariate analysis --- Structural equation modeling --- Distribution-free statistics --- Statistics, Distribution-free --- Statistics, Nonparametric --- Methoden en technieken: algemene handboeken en reeksen --- Mathematics --- Physical Sciences & Mathematics --- Mathematical Statistics --- Nonparametric statistics. --- Regression analysis. --- Regression Analysis
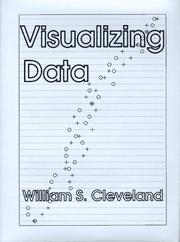
ISBN: 0963488406 9780963488404 Year: 1993 Publisher: Murray Hill, N.J. At&T Bell Laboratories Hobart Press
Abstract | Keywords | Export | Availability | Bookmark
 Loading...
Choose an application
- Reference Manager
- EndNote
- RefWorks (Direct export to RefWorks)
Visualization methods. A strategy for data analysis that stresses the use of visualization to thoroughly study the structure of data and to check the validity of mathematical and statistical models fitted to data. Prerequisites: Basic statistics and least-squares fitting.
Mathematical statistics --- Statistique mathématique --- Graphic methods --- Méthodes graphiques --- 519.25 --- AA / International- internationaal --- 302 --- 001.4224 --- -Mathematical statistics --- -Mathematics --- Statistical inference --- Statistics, Mathematical --- Statistics --- Probabilities --- Sampling (Statistics) --- Statistical data handling --- Opmaak en presentatie van statistische reeksen en tabellen. Grafieken. --- Statistical methods --- -Statistical data handling --- 519.25 Statistical data handling --- -519.25 Statistical data handling --- Mathematics --- Statistique mathématique --- Méthodes graphiques --- Opmaak en presentatie van statistische reeksen en tabellen. Grafieken --- Mathematical statistics - Graphic methods --- QA 276.3 Graphic methods --- Methods --- Computer Imaging, Graphics & Vision
ISBN: 1555443818 9781555443818 Year: 1990 Publisher: Cary, NC SAS Institute
Abstract | Keywords | Export | Availability | Bookmark
 Loading...
Choose an application
- Reference Manager
- EndNote
- RefWorks (Direct export to RefWorks)
681.3 --- Computerwetenschap --- Informatica 681.3 --- Statistische analyse 519.23 --- #SERV: inv. Leuven --- 681.3*G3 --- #ECO:04.09:sectoren IT-technologie ICT internet --- 681.3*G3 Probability and statistics: probabilistic algorithms (including Monte Carlo);random number generation; statistical computing; statistical software (Mathematics of computing) --- Probability and statistics: probabilistic algorithms (including Monte Carlo);random number generation; statistical computing; statistical software (Mathematics of computing) --- 681.3* / / / / / / / / / / / / / / / / / / / / / / / / / / / / --- #WDIR:wbse --- #SBIB:303H4 --- #SBIB:303H60 --- AA / International- internationaal --- 654 --- Informatica in de sociale wetenschappen --- Bijzondere methoden: algemeen --- Informatieverwerking. Bureautica. --- Informatieverwerking. Bureautica --- QA 76.755 - Computer Software. Handbook --- Statistics --- Handbooks --- Software --- SAS
ISBN: 0340806559 9780340806555 Year: 2003 Volume: 3 Publisher: London Arnold
Abstract | Keywords | Export | Availability | Bookmark
 Loading...
Choose an application
- Reference Manager
- EndNote
- RefWorks (Direct export to RefWorks)
This new edition of this classic incorporates the most recent thinking on methodology and software, as well as the latest literature on multilevel statistical models. Topics covered by multilevel models have increased in recent years, and the methods are widely applied in the social sciences as well as in areas such as epidemiology, geography, education, surveys, and medicine. This third edition includes chapters on meta analysis, factor analysis and structural equation models, and has expanded sections on MCMC methods.
Mathematical statistics --- Social sciences --- Educational tests and measurements --- Mathematical models --- Research --- Methodology --- 519.2 --- #PBIB:2003.3 --- Probability. Mathematical statistics --- Mathematical models. --- Methodology. --- 519.2 Probability. Mathematical statistics --- Behavioral sciences --- Human sciences --- Sciences, Social --- Social science --- Social studies --- Civilization --- Research&delete& --- Social sciences - Mathematical models --- Social sciences - Research - Methodology --- Educational tests and measurements - Mathematical models --- H61.25 Mathematics. Mathematical models --- Methods
Book
ISBN: 9783319242750 Year: 2016 Publisher: Berlin Springer
Abstract | Keywords | Export | Availability | Bookmark
 Loading...
Choose an application
- Reference Manager
- EndNote
- RefWorks (Direct export to RefWorks)
This update to the classic book by ggplot2 creator Hadley Wickham upgrades the book to match the many upgrades to ggplot2 that have happened in the last five years. ggplot2 is a data visualization package for R that helps users create data graphics, including those that are multi-layered, with ease. With ggplot2, it's easy to : superimpose multiple layers (points, lines, maps, tiles, box plots) from different data sources with automatically adjusted common scales ; add customizable smoothers that use powerful modeling capabilities of R, such as loess, linear models, generalized additive models, and robust regression ; save any ggplot2 plot (or part thereof) for later modification or reuse ; create custom themes that capture in-house or journal style requirements and that can easily be applied to multiple plots ; approach a graph from a visual perspective, thinking about how each component of the data is represented on the final plot. This book will be useful to everyone who has struggled with displaying data in an informative and attractive way. Some basic knowledge of R is necessary (e.g., importing data into R). ggplot2 is a mini-language specifically tailored for producing graphics, and you'll learn everything you need in the book. After reading this book you'll be able to produce graphics customized precisely for your problems, and you'll find it easy to get graphics out of your head and on to the screen or page. New to this edition : brings the book up-to-date with ggplot2 2.1.0, including major updates to the theme system ; new scales, stats and geoms added throughout ; additional practice exercises ; a revised introduction that focuses on ggplot() instead of qplot() ; updated chapters on data and modeling using tidyr, dplyr and broom.
Graphic methods. --- R (Computer program language) --- GNU-S (Computer program language) --- Domain-specific programming languages --- Graphics --- Graphs --- Geometrical drawing --- Least squares --- Mathematics --- Mechanical drawing --- Data Interpretation, Statistical --- Systems Analysis --- Software --- Computer Imaging, Graphics & Vision --- QA 76.755 - Computer Software. Handbook --- Graphic methods --- Statistics --- Computer graphics --- Visualization --- Mathematical statistics --- Statistiques. --- Statistique mathématique. --- Infographie --- Data visualisation. --- Logiciels. --- Statistiques
| Listing 1 - 10 of 16 | << page >> |
Sort by
|

 Search
 Feedback
 About
About Help
Help News
News