| Listing 1 - 1 of 1 |
Sort by
|

ISBN: 0387329064 9780387329062 9786610938421 1280938420 0387379770 Year: 2006 Publisher: New York: Springer,
Abstract | Keywords | Export | Availability | Bookmark
 Loading...
Choose an application
- Reference Manager
- EndNote
- RefWorks (Direct export to RefWorks)
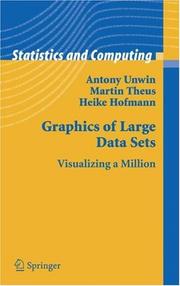
Graphics are great for exploring data, but how can they be used for looking at the large datasets that are commonplace to-day? This book shows how to look at ways of visualizing large datasets, whether large in numbers of cases or large in numbers of variables or large in both. Data visualization is useful for data cleaning, exploring data, identifying trends and clusters, spotting local patterns, evaluating modeling output, and presenting results. It is essential for exploratory data analysis and data mining. Data analysts, statisticians, computer scientists-indeed anyone who has to explore a large dataset of their own-should benefit from reading this book. New approaches to graphics are needed to visualize the information in large datasets and most of the innovations described in this book are developments of standard graphics. There are considerable advantages in extending displays which are well-known and well-tried, both in understanding how best to make use of them in your work and in presenting results to others. It should also make the book readily accessible for readers who already have a little experience of drawing statistical graphics. All ideas are illustrated with displays from analyses of real datasets and the authors emphasize the importance of interpreting displays effectively. Graphics should be drawn to convey information and the book includes many insightful examples. Antony Unwin holds the Chair of Computer Oriented Statistics and Data Analysis at the University of Augsburg. He has been involved in developing visualization software for twenty years. Martin Theus is a Senior Researcher at the University of Augsburg, has worked in industry and research in both Germany and the USA, and is the author of the visualization software Mondrian. Heike Hofmann is Assistant Professor of Statistics at Iowa State University. She wrote the software MANET and has also cooperated in the development of the GGobi software.
Artificial intelligence. Robotics. Simulation. Graphics --- Information systems --- QA 276.3 Graphic methods --- Computational Science & Engineering --- Computational Statistics --- Computer Imaging, Graphics & Vision --- Computer Science --- Statistics --- Computer graphics. --- Statistique --- Infographie --- Graphic methods. --- Méthodes graphiques --- Computer graphics --- Graphic methods --- Statistics -- Graphic methods. --- Mathematics --- Physical Sciences & Mathematics --- Mathematical Statistics --- Méthodes graphiques --- EPUB-LIV-FT LIVSTATI SPRINGER-B --- Automatic drafting --- Graphic data processing --- Graphics, Computer --- Diagrams, Statistical --- Statistical diagrams --- Mathematics. --- Operations research. --- Decision making. --- Data mining. --- Visualization. --- Computer software. --- Statistics. --- Mathematical Software. --- Statistical Theory and Methods. --- Data Mining and Knowledge Discovery. --- Operation Research/Decision Theory. --- Computer Graphics. --- Computer art --- Graphic arts --- Electronic data processing --- Engineering graphics --- Image processing --- Statistical analysis --- Statistical data --- Statistical methods --- Statistical science --- Econometrics --- Software, Computer --- Computer systems --- Visualisation --- Imagery (Psychology) --- Imagination --- Visual perception --- Algorithmic knowledge discovery --- Factual data analysis --- KDD (Information retrieval) --- Knowledge discovery in data --- Knowledge discovery in databases --- Mining, Data --- Database searching --- Deciding --- Decision (Psychology) --- Decision analysis --- Decision processes --- Making decisions --- Management --- Management decisions --- Choice (Psychology) --- Problem solving --- Operational analysis --- Operational research --- Industrial engineering --- Management science --- Research --- System theory --- Math --- Science --- Digital techniques --- Decision making --- Curve fitting --- Mathematical statistics. --- Operations Research/Decision Theory. --- Statistical inference --- Statistics, Mathematical --- Probabilities --- Sampling (Statistics) --- Statistics . --- Statistics - Graphic methods
| Listing 1 - 1 of 1 |
Sort by
|

 Search
 Feedback
 About UniCat
  Help
Help News
News