
 Search
 Feedback
 About UniCat
  Help
Help News
News
| Listing 1 - 3 of 3 |
Sort by
|
ISBN: 0521226066 Year: 1982
Abstract | Keywords | Export | Availability | Bookmark
 Loading...
Choose an application
- Reference Manager
- EndNote
- RefWorks (Direct export to RefWorks)
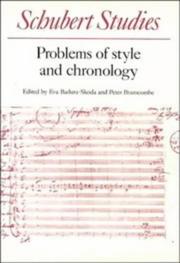
This collection of articles, written by European, American and British scholars, clarifies problems of style and chronology in the music Schubert composed during the last decade of his life. Althought O. E. Deutsch's documentary biography and memoirs set new milestones in Schubert research, they left some problems of chronology unanswered. Some of the essays in this volume examine or re-examine these problems, using different methods. Robert Winter, in the longest essay, proposes numerous re-datings of works composed between 1822 and 1828 which result from a careful examination of types of paper and watermarks. Other contributors point out the limitations of applying stylistic criteria as the basis for the dating of individual works. The articles touch on all areas of Schubert's output, with the emphasis on his songs, theatre music, and orchestral and chamber works. Althought this book will be of primary interest to musicologists, and others interested in Schubert, the essays concerned with song and the theatre will also attract a wider readership.
Annals --- Chronologie [Historische ] --- Chronologie historique --- Chronology [Historical] --- Dates --- Historical chronology --- Historische chronologie --- History--Chronology --- World chronology--History --- Schubert, Franz, --- Schubert, Franz --- Schubert, Franz Peter, --- Shu-po-tʻe, --- Shubert, F. --- Shubert, Frant︠s︡, --- Šubertas, F. (Francas), --- Šubertas, Francas Peteris, --- שוברט, פרנץ
Book
ISBN: 9789463937290 Year: 2022 Publisher: Ghent Owl Press
Abstract | Keywords | Export | Availability | Bookmark
Loading...Choose an application
- Reference Manager
- EndNote
- RefWorks (Direct export to RefWorks)
Charts are an excellent way to share complex ideas or large amounts of data with your audience. But they are also hard to make: which chart works best in which situation ? and why? What color scheme should you use to strengthen your message? What are some common pitfalls to avoid? How can you add the perfect title, labels, legend and caption? And how do you move beyond a boring pie or bar chart?Powerful Charts explains how basic design and communication principles help you decide which chart type is best for you, which out-of-the-box charts might grab the attention of your audience, and how you should style them. We?ll look at tools, techniques and workflows to create beautiful, clear and convincing charts that go far beyond the default spreadsheet graphs. Make the data visuals in your next presentation, report, app or article shine!Bron : https://www.borgerhoff-lamberigts.be/owl-press/shop/boeken/powerful-charts
Methods in social research (general) --- Artificial intelligence. Robotics. Simulation. Graphics --- visualisatie --- Beelden --- data --- 001.8 --- grafieken --- 001.817 --- Statistical science --- graphic design --- visualization [computer] --- dates [spans of time] --- scientific illustrations [images] --- grafische communicatie --- datavisualisatie --- grafische vormgeving --- Datavisualisatie --- Grafiek --- Diagram --- Data visualisation.
ISBN: 9781568987637 9781616890582 1568987633 Year: 2010 Publisher: New York : Princeton Architectural press,
Abstract | Keywords | Export | Availability | Bookmark
Loading...Choose an application
- Reference Manager
- EndNote
- RefWorks (Direct export to RefWorks)
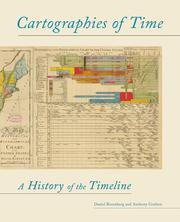
"From the most ancient images to the contemporary, the line serves as a central figure in the representation of time. The linear metaphor is ubiquitous in visual representations of time - in almanacs, calendars, charts, and graphs of all sorts. Even our everyday speech is filled with talk of time having a "before" and an "after" or being "long" and "short." The timeline is such a familiar part of our mental furniture that it is sometimes hard to remember that we ever acquired it in the first place. And yet, in its modern form, the timeline is not even 250 years old. The story of what came before has until now never been fully told." "Cartographies of Time is the first comprehensive history of graphic representations of time in Europe and the United States from 1450 to the present. Authors Daniel Rosenberg and Anthony Grafton have crafted a lively history featuring fanciful characters and unexpected twists and turns. From medieval manuscripts to websites, Cartographies of Time features a wide variety of timelines that in their own unique ways - curving, crossing, branching - defy conventional thinking about the form. A fifty-four-foot-long timeline from 1753 is mounted on a scroll and encased in a protective box, while another timeline uses the different parts of the human body to show the genealogies of Jesus Christ and the rulers of Saxony. Ladders created by Catholic and Protestant missionaries illustrate Bible stories in a vertical format to encourage American Indians in Oregon to convert. Also included is the April 1912 Marconi North Atlantic Communication chart, which tracked ships, including the Titanic, at points in time rather than by their geographic location. There are even little-known works by famous figures, including a historical chronology by the mapmaker Gerardus Mercator and a chronological board game patented by Mark Twain. This lavishly illustrated edition is a revelation to anyone interested in the role visual forms have played incur evolving conception of history."--BOOK JACKET.
Book history --- History as a science --- Geodesy. Cartography --- Chronology, Historical. --- Chronology, Historical --- History --- Chronologie historique --- Histoire --- Maps. --- Philosophy. --- Atlas --- Philosophie --- grafische vormgeving --- grafisch design --- informatiedesign --- tijd --- tijdlijnen --- kunst --- 766.022 --- 006.9 --- 766 --- 93/94 --- 912 <09> --- 930.11 --- Tijd --- Chronologie --- Grafische vormgeving --- Geschiedenis --- Cartografie. Kaarten. Plattegronden. Atlassen--Geschiedenis van ... --- Filosofie van de geschiedenis. Geschiedenisfilosofie --- 930.11 Filosofie van de geschiedenis. Geschiedenisfilosofie --- History, Modern --- Annals --- Dates (Chronology) --- Historical chronology --- World history --- Philosophy --- Cartografie. Kaarten. Plattegronden. Atlassen--Geschiedenis van .. --- Cartografie. Kaarten. Plattegronden. Atlassen--Geschiedenis van . --- PXL-Music 2017 --- geschiedenis --- kaarten --- dataverzameling --- visualiseren --- Cartografie. Kaarten. Plattegronden. Atlassen--Geschiedenis van
| Listing 1 - 3 of 3 |
Sort by
|