
 Search
 Feedback
 About UniCat
  Help
Help News
News
| Listing 1 - 10 of 20 | << page >> |
Sort by
|
Book
ISBN: 9789464700220 Year: 2023 Publisher: Wommelgem : VAN IN,
Abstract | Keywords | Export | Availability | Bookmark
 Loading...
Choose an application
- Reference Manager
- EndNote
- RefWorks (Direct export to RefWorks)
Met Power BI zijn Business Intelligence (BI) en rapportage voor iedereen toegankelijk. Verbinding maken met verschillende gegevensbronnen, gegevens opvragen en transformeren, gegevens modelleren en krachtige, dynamische rapporten maken: met Power BI kan het allemaal. Komen onder meer aan bod in dit handboek: Power BI met MS Excel; BI-architectuur; de onderdelen van Power BI; data uit verschillende gegevensbronnen importeren en transformeren; relaties leggen tussen verschillende tabellen; rapporten en dashboards maken en delen; verschillende business cases; een inleiding tot big data; oplossingenbestanden. Met oefeningen bij elk hoofdstuk.
Book
ISBN: 9780262018159 Year: 2013 Publisher: Cambridge (Mass.) MIT
Abstract | Keywords | Export | Availability | Bookmark
Loading...Choose an application
- Reference Manager
- EndNote
- RefWorks (Direct export to RefWorks)
Information visualization --- Inquiry (Theory of knowledge) --- Web-based user interfaces --- 766.022 --- grafisch design --- grafische vormgeving --- grafisch ontwerp --- informatiedesign --- interactiviteit --- Web user interfaces --- WUIs (Web-based user interfaces) --- WUIs (Web user interfaces) --- User interfaces (Computer systems) --- Knowledge, Theory of --- Data visualization --- Visualization of information --- Information science --- Visual analytics --- Data processing
Book
ISBN: 9783899554151 Year: 2012 Publisher: Berlin Gestalten
Abstract | Keywords | Export | Availability | Bookmark
Loading...Choose an application
- Reference Manager
- EndNote
- RefWorks (Direct export to RefWorks)
Informotion is the first reference book devoted to the fundamentals of creating compelling animated infographics. It explains key aspects of how to effectively visualize data, outlines factors that improve the viewer’s ability to absorb information, and explores both current tools and future possibilities for crafting moving images. Each book contains a unique log-in code for accessing a wide selection of animated information graphics as well as their making-of videos online. The interplay between the detailed descriptions in the print edition —including a preface by co-editor Stefan Fichtel, who runs his own infographics studio with clients such as Porsche and National Geographic — and the diverse motion material makes Informotion an essential reference for anyone interested in working successfully with these burgeoning visual formats.
Telecommunication technology --- Graphic arts --- visualisatie (informatica) --- Artificial intelligence. Robotics. Simulation. Graphics --- video-opnamen --- videotoepassingen --- 766.022 --- animatie --- grafisch design --- grafisch ontwerp --- grafische vormgeving --- informatiedesign --- 754.46 --- diagrammen --- grafieken --- illustraties --- signalisatie (bewegwijzering) --- tabellen --- grafische vormgeving, volgens thema, info/bewegwijzering --- Information visualization --- Visual communication --- Data visualization --- Visualization of information --- Art, Graphic --- Arts, Graphic --- Graphic design (Graphic arts) --- Graphics --- Graphic communication --- Imaginal communication --- Pictorial communication --- Design --- Information science --- Visual analytics --- Art --- Communication --- datavisualisatie
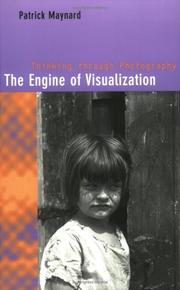
ISBN: 0801486890 9780801486890 0801433657 9780801433658 Year: 2000 Publisher: Ithaca (N.Y.) : Cornell university press,
Abstract | Keywords | Export | Availability | Bookmark
Loading...Choose an application
- Reference Manager
- EndNote
- RefWorks (Direct export to RefWorks)
77.01 --- Fotografie--Semiotiek van de fotografie. Theorie --- 77.01 Fotografie--Semiotiek van de fotografie. Theorie --- Patrick Maynard --- fotografische theorie --- fotografie en technologie --- fotografie --- fotografietheorie --- techniek --- kunsttheorie --- perceptie --- technologie --- esthetica --- CDL --- Photography --- Visualization. --- Philosophy. --- Visualization --- Visualisation --- Imagery (Psychology) --- Imagination --- Visual perception --- Philosophy --- Photographie --- Philosophie
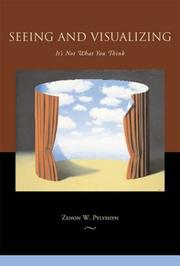
ISBN: 0262162172 0262661977 0262316315 9780262316316 9780262162173 9780262661973 Year: 2006 Publisher: Cambridge, Massachusetts ; London, England : The MIT Press,
Abstract | Keywords | Export | Availability | Bookmark
Loading...Choose an application
- Reference Manager
- EndNote
- RefWorks (Direct export to RefWorks)
In Seeing and Visualizing, Zenon Pylyshyn argues that seeing is different from thinking and that to see is not, as it may seem intuitively, to create an inner replica of the world. Pylyshyn examines how we see and how we visualize and why the scientific account does not align with the way these processes seem to us "from the inside." In doing so, he addresses issues in vision science, cognitive psychology, philosophy of mind, and cognitive neuroscience. First, Pylyshyn argues that there is a core stage of vision independent from the influence of our prior beliefs and examines how vision can be intelligent and yet essentially knowledge-free. He then proposes that a mechanism within the vision module, called a visual index (or FINST), provides a direct preconceptual connection between parts of visual representations and things in the world, and he presents various experiments that illustrate the operation of this mechanism. He argues that such a deictic reference mechanism is needed to account for many properties of vision, including how mental images attain their apparent spatial character without themselves being laid out in space in our brains. The final section of the book examines the "picture theory" of mental imagery, including recent neuroscience evidence, and asks whether any current evidence speaks to the issue of the format of mental images. This analysis of mental imagery brings together many of the themes raised throughout the book and provides a framework for considering such issues as the distinction between the form and the content of representations, the role of vision in thought, and the relation between behavioral, neuroscientific, and phenomenological evidence regarding mental representations.Review: Pylyshyn's book is to be commended as a thorough and persuasive defense of the information-processing approach to vision and visualizing. It should be essential reading for psychologists, cognitive scientists, and philosophers
Cognitive psychology --- Philosophical anthropology --- Categorization (Psychology) --- Cognitive science --- Mental representation --- Recognition (Psychology) --- Visual perception --- Visualization --- Visualisation --- Imagery (Psychology) --- Imagination --- Optics, Psychological --- Vision --- Perception --- Visual discrimination --- Memory --- Representation, Mental --- Abstraction --- Science --- Philosophy of mind --- Classification (Psychology) --- Psychological aspects --- Visualization. --- Perception visuelle. --- Visualisation. --- Représentation mentale. --- Recognition (psychologie) --- Catégorisation (psychologie) --- Visual perception. --- Mental representation. --- Cognitive science. --- COGNITIVE SCIENCES/General --- NEUROSCIENCE/Visual Neuroscience


ISBN: 9783899552171 9783899552782 3899552784 3899552172 Year: 2010 Publisher: Berlin Gestalten
Abstract | Keywords | Export | Availability | Bookmark
Loading...Choose an application
- Reference Manager
- EndNote
- RefWorks (Direct export to RefWorks)
"The eight comprehensive chapters in Data Flow 2 expand the definition of contemporary information graphics. Wide-ranging examples introduce new techniques and forms of expression. In addition to the inspiring visuals, interviews with the New York Times's Steve Duenes, Infosthetic's Andrew Vande Moere, Visualcomplexity's Manuel Lima, Art+Com's Joachim Sauter, and passionate cartographer Menno-Jan Kraak as well as text features by Johannes Schardt provide insight into the challenges of creating effective work."--Cover.
scientific illustrations [images] --- grafische communicatie --- Advertising. Public relations --- reclamevormgeving --- Graphic arts --- visualisatie (informatica) --- visualization [computer] --- wetenschappelijke illustraties --- grafische vormgeving --- graphic design --- advertising --- Design. --- Diagramm. --- Gebrauchsgraphik. --- Visual communication. --- Communication in design. --- Information visualization. --- Arts graphiques --- Communication visuelle --- Communication en design --- Visualisation de l'information --- History --- Histoire --- 766.022 --- diagrammen --- eenentwintigste eeuw --- grafieken --- grafisch design --- informatie --- informatiedesign --- 766 --- grafisch ontwerpen --- 007 --- 655 --- 31 --- 766:659.2 --- Architecturale communicatiemethoden ; portfolio's ; diagrammen --- toegepaste grafische kunsten --- Visuele communicatie --- Grafische vormgeving --- Toegepaste grafische kunst --- Grafische industrie --- Gebruiksgrafiek --- Statistieken --- Statistiek --- Gebruiksgrafiek ; voorlichting ; adviezen --- Communication in design --- Information visualization --- Visual communication --- 754.46 --- signalisatie (bewegwijzering) --- tabellen --- Graphic communication --- Imaginal communication --- Pictorial communication --- Communication --- Data visualization --- Visualization of information --- Information science --- Visual analytics --- Art, Graphic --- Arts, Graphic --- Graphic design (Graphic arts) --- Graphics --- Art --- Design --- grafische vormgeving, volgens thema, info/bewegwijzering --- Information systems --- departement Beeldende Kunst 09 --- diagram --- 766.32.044 --- Grafische industrie en ontwerp ; beeld ; illustratie ; thema's ; infographics --- communication design
Book
ISBN: 9789493148031 9493148033 Year: 2019 Volume: 168 Publisher: [Eindhoven] Onomatopee
Abstract | Keywords | Export | Availability | Bookmark
Loading...Choose an application
- Reference Manager
- EndNote
- RefWorks (Direct export to RefWorks)
Diagrams of Power' collects contemporary artworks and projects that use data, diagrams, maps and visualizations as ways of challenging dominant narratives and supporting the resilience of marginalized communities. The artists and designers featured critique conventionalized and established truths that obscure important histories or perpetuate oppressive regimes; they also contribute to positive social change by engaging communities and providing alternative strategies for storytelling, communication and organizing. Historical and contemporary uses of data and visualization in colonization, surveillance and management are problematized through critical interventions that use performance, embodiment and counternarratives.
Social justice --- Information visualization --- Graphic arts --- Charts, diagrams, etc --- Cartography --- grafisch ontwerp --- grafische vormgeving --- grafisch design --- cartografie --- 766.022 --- ecologie --- activisme --- kunst en politiek --- politiek --- information design --- informatiedesign --- 766:659.2 --- Visuele communicatie --- Diagrammen ; mappen --- Visuele presentatie --- 754.46 --- mapping --- kunst --- diagrammen --- infographics --- data-analyse --- Equality --- Justice --- Diagrams, charts, etc. --- Graphs --- Plots (Diagrams) --- Data visualization --- Visualization of information --- Information science --- Visual analytics --- Exhibitions --- Gebruiksgrafiek ; voorlichting ; adviezen ; dataverwerking --- grafische vormgeving, volgens thema, info/bewegwijzering --- 766.32.044 --- Grafische industrie en ontwerp ; beeld ; illustratie ; thema's ; infographics
Book
ISBN: 9781846148477 Year: 2014 Publisher: London : Particular Books,
Abstract | Keywords | Export | Availability | Bookmark
Loading...Choose an application
- Reference Manager
- EndNote
- RefWorks (Direct export to RefWorks)
Information visualization --- City and town life --- Lifestyles --- Visualisation de l'information --- Vie urbaine --- Style de vie --- Maps --- Cartes --- London (England) --- Londres (Angleterre) --- Social life and customs --- Statistics --- Moeurs et coutumes --- Statistiques --- Maps. --- Statistics.
Book
ISBN: 9781846149061 1846149061 Year: 2016 Publisher: London : Particular Books,
Abstract | Keywords | Export | Availability | Bookmark
Loading...Choose an application
- Reference Manager
- EndNote
- RefWorks (Direct export to RefWorks)
From an award-winning project comes an inspiring, collaborative book that makes data artistic, personal, and open to all. Each week for a year, Giorgia and Stefanie sent each other a postcard describing what had happened to them during that week around a particular theme. But they didn't write it, they drew it: a week of smiling, a week of apologies, a week of desires. Presenting their fifty-two cards, along with thoughts and ideas about the data-drawing process, Dear Data hopes to inspire you to draw, slow down and make connections with other people, to see the world through a new lens, where everything and anything can be a creative starting point for play and expression.
Information visualization. --- Data Collection. --- 741.07 --- 741.039 --- Tekenkunst ; getekende dagboeken ; 2014-2016 ; G. Lupi & St. Posavec --- Visuele communicatie ; tekeningen van concrete en abstracte thema's --- Postkaarten ; gemaakt door kunstenaars ; 20ste en 21ste eeuw --- Ansichtkaarten ; prentbriefkaarten ; van kunstenaars --- Lupi, Giorgia °? (°Mirandola, Italië) --- Posavec, Stephanie °? (°Denver, Colorado, Verenigde Staten) --- Data Aggregation --- Data Collection Methods --- Dual Data Collection --- Aggregation, Data --- Collection Method, Data --- Collection Methods, Data --- Collection, Data --- Collection, Dual Data --- Data Collection Method --- Method, Data Collection --- Methods, Data Collection --- Medical History Taking --- Empirical Research --- Data visualization --- Visualization of information --- Information science --- Visual analytics --- Tekenkunst ; tekenkunstenaars A - Z --- Tekenkunst ; 2000 - 2050 --- Information visualization --- Data Collection --- 766.022 --- 741.071 POSAVEC --- 741.071 LUPI --- prentkaarten --- postkaarten --- eenentwintigste eeuw --- information design --- informatiedesign --- grafisch ontwerp --- grafisch design --- grafische vormgeving --- tekenkunst --- Lupi Giorgia --- Posavec Stephanie --- Curiosities and wonders. --- 766.32.044 --- Mail art --- Grafische industrie en ontwerp ; beeld ; illustratie ; thema's ; infographics --- Lupi, Giorgia --- Posavec, Stefanie
Book
ISBN: 9783037786581 3037786582 Year: 2021 Publisher: Zurich Lars Müller Publishers
Abstract | Keywords | Export | Availability | Bookmark
Loading...Choose an application
- Reference Manager
- EndNote
- RefWorks (Direct export to RefWorks)
The shift towards digital modes of production has fundamentally changed both cartography and graphic design. The omni-present computer, the interactive possibilities of digital media and the direct exchange of visual information through networks have blurred the distinction between designers and users of visual information. Blind Maps and Blue Dots is the first work to explore the disappearing boundaries between producers and users of maps. Using three mapmaking practices as examples - the Blue Dot, the location function in Google Maps; the Strava Global Heatmap, a world map showing the activities of a fitness app; and the 'Situation in Syria' maps, a regularly updated map of the Syrian conflict made by an Amsterdam teenager - renowned designer Joost Grootens shows the blurring of the binary distinction between producing and using, ultimately offering a whole new approach to graphic design.
Cartography --- Graphic design --- Information visualization. --- grafisch ontwerp --- 766.022 --- cartografie --- informatiedesign --- information design --- grafische vormgeving --- grafisch design --- Graphic arts --- digital maps --- masters theses --- graphic arts --- maps [documents] --- dot maps --- cartography [discipline] --- onderzoek in de kunsten --- Syria
| Listing 1 - 10 of 20 | << page >> |
Sort by
|